


EURUSD, GBPUSD, NZDUSD gradual recovery on the chart
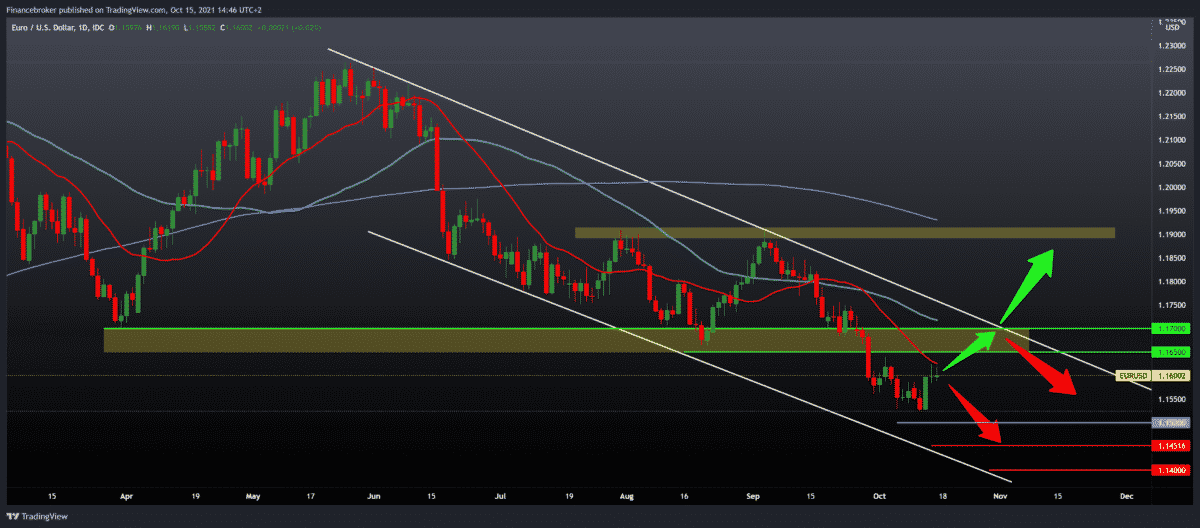
Looking at the EURUSD chart on the daily time frame, we see that the pair is the same as yesterday at 1.16000. We are still testing the 20-day moving average, and for further continuation on the bullish side, we need further positive consolidation that will raise us to the zone 1.16500-1.17000. Wider view, we are moving in a descending channel, and for a more specific bullish scenario, we need a break above the top line of this channel. Only after that, we can expect further growth of EURUSD on the chart at the previous high. For the bearish scenario, we need a subtraction of the 20-day moving average, then a negative consolidation that directs us to the previous low at 1.15250. If the impulse is too strong, then a break below is very likely.

GBPUSD chart analysis
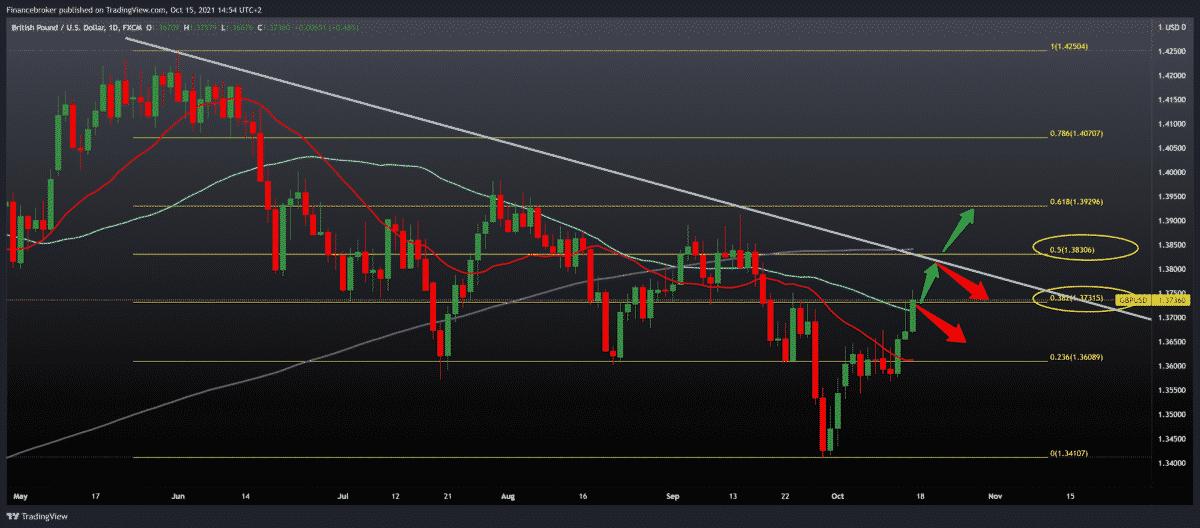
Looking at the GBPUSD chart on the daily time frame, we see that the pair today managed to make a break above the 38.2% Fibonacci level of 1.37300 and above the 50-day moving average. Next week we can expect further progress towards the next Fibonacci level at 50.0%, where a 200-day moving average of 1,38300 awaits us. We need a withdrawal below the current support zone for the bearish scenario, and then we seek support at the lower 23.6% Fibonacci level at 1.36000.

NZDUSD chart analysis
Looking at the NZDUSD chart on the daily time frame, we see that the pair made a huge improvement yesterday from 0.69600 to the current 0.70600. We can now say that we are testing the 61.8% -78.6% Fibonacci level zone 0.70500-0.71000. The New Zealand Bank is the first of the eight major currencies to raise interest rates, and based on that; we can expect the former to strengthen against other currencies. Next week, we can expect the NZDUSD to test a 200-day moving average in the upper downward trend line zone. In this zone, we can expect the next resistance and a shorter pull within the new bullish impulse.

Market overview
European registrations of new cars fell for the third month in a row in September and noted the lowest level for the month since 1995, data from the European Automobile Manufacturers Association showed on Friday.
Passenger car registrations fell 23.1 percent year-on-year to 718,598 units in September, after falling 19.1 percent in August.
The latest decline is largely caused by a shortage of vehicles due to the ongoing shortage of semiconductors, the Brussels-based ACEA said.
All major EU markets fell in double digits. Italy recorded the worst drop of 32.7 percent, followed by Germany with a drop of 25.7 percent. Sales fell 20.5 percent in France and 15.7 percent in Spain.
In the period from January to September, car registrations in the EU increased by 6.6 percent compared to the same period last year.
New Zealand’s manufacturing sector returned to growth territory in September, BusinessNZ’s latest survey showed on Friday with a seasonally adjusted production performance index score of 51.4.
This increases from 40.1 in August and moves back above the rise-rise line of 50 that separates the spread from the contraction.
Among the individual components, employment (54.5), new orders (54.3), and finished inventories (50.1) were expanding, while deliveries (47.8) and production (49.9) remained declining.
“The recovery that PMI experienced in September was encouraging,” said BNZ senior economist Craig Ebert. “The credit is where it came from because the NZ PMI recorded much less contractions and faster stabilization, compared to what it went through during the initial COVID-19 epidemic.”
-
Support
-
Platform
-
Spread
-
Trading Instrument

