EURUSD and GBPUSD: EURUSD faces resistance at 1.09100
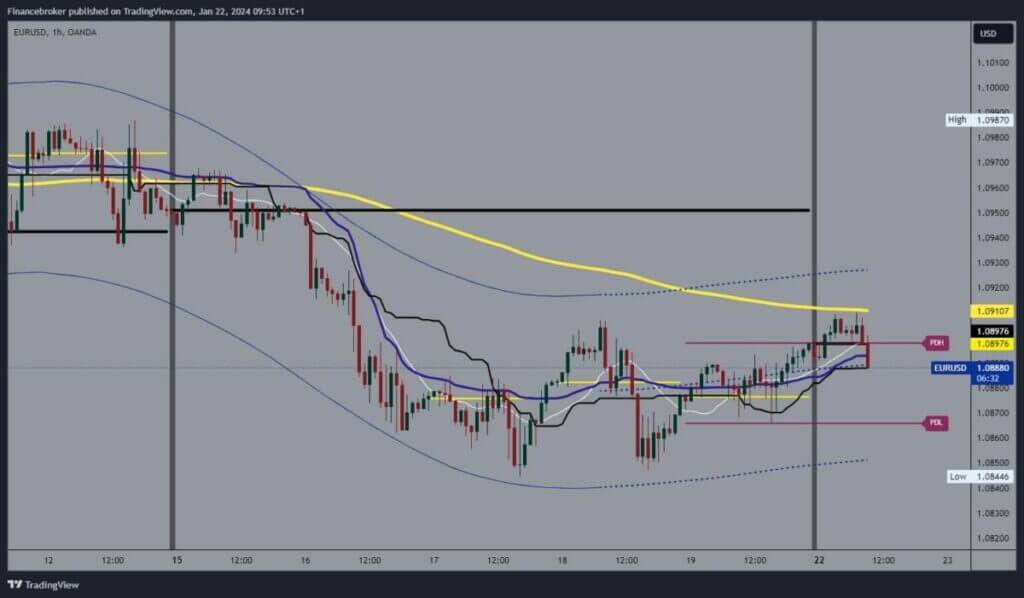
- During the Asian trading session, EURUSD moved in the 1.08950-1.09100 range.
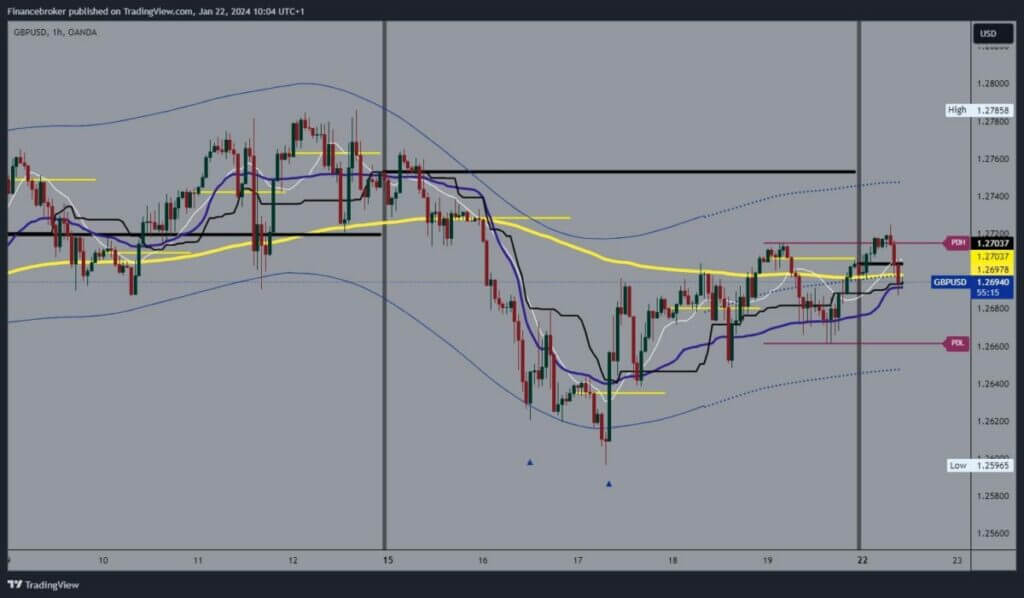
- During the Asian session, we saw a GBPUSD recovery to 1.27250 levels.
EURUSD chart analysis
During the Asian trading session, EURUSD moved in the 1.08950-1.09100 range. In the EU session, the euro starts to show bearish signs and bounces down from 1.09100 and the EMA200 moving average. The pair is breaking below the Asian support level, intensifying the bearish pressure. That could lead to a pullback to Friday’s support. On Friday, we managed to hold above the 1.08700 level. A break below would form a new daily low and thus confirm a bearish option.
Potential lower targets are 1.08600 and 1.08500 levels. For a bullish option, we need to go back to the 1.09100 level and test the EMA200 moving average. Then we would have to move above and stay up there. With that, we would form a bottom, and it would be easier for us to start a further recovery. Potential higher targets are 1.09200 and 1.09300 levels.

GBPUSD chart analysis
During the Asian session, we saw a GBPUSD recovery to 1.27250 levels. After that, the pair stops at that level and begins a pullback that continues at the beginning of the EU session. We are looking at a pullback below 1.27000 and the EMA200 moving average. This could be the start of a bigger pullback unless we get back above the 1.27000 level. Potential lower targets are 1.26800 and 1.26600. The previous low is at the 1.26600 level.
We need to get back above the 1.27000 level and the EMA200 for a bullish option. After that, we need to keep up there. A new positive consolidation would trigger a recovery, and we would likely see the formation of a new daily high. Potential higher targets are 1.27200 and 1.27400 levels.


