EURUSD and GBPUSD annual chart overview
EURUSD chart analysis
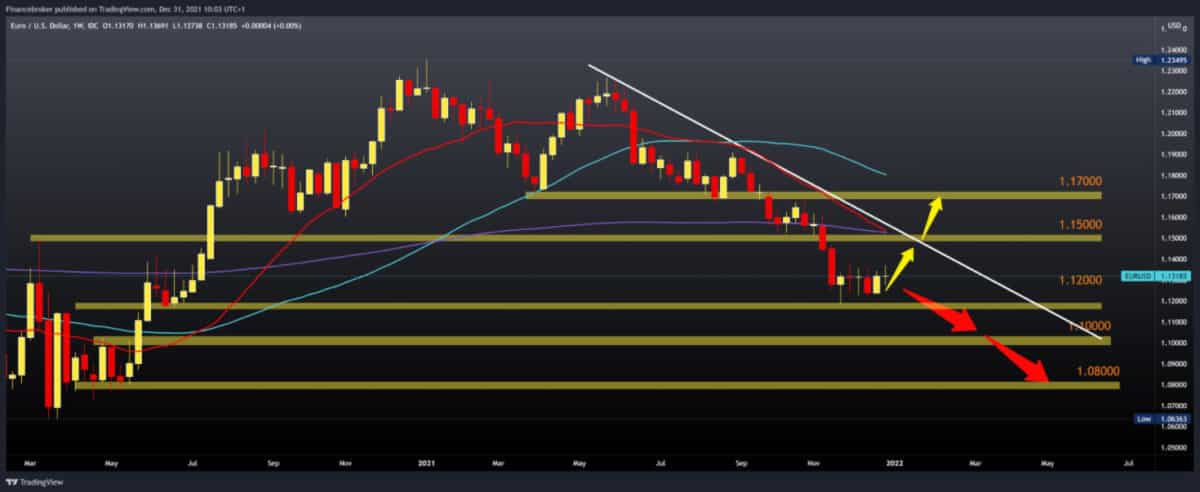
The annual chart review shows that EURUSD has been in a bearish trend throughout 2021. On January 4, the pair had its maximum at 1.23495. After that, the retreat to lower levels begins. In April, the pair found support for the MA50 moving average at 1.17000 and tried again to continue the bullish trend. In May, the pair failed to form a new higher high and confirm further recovery. We stopped at 1.22670, and after that, the pair entered the bearish trend. In November, this year’s minimum was formed at 1,11850, while in December, we are consolidating in the range of 1.12000-1.13000. It is more likely that we will see the continuation of the bearish trend at the beginning of next year, and our target is the first support at 1,10000.

GBPUSD chart analysis
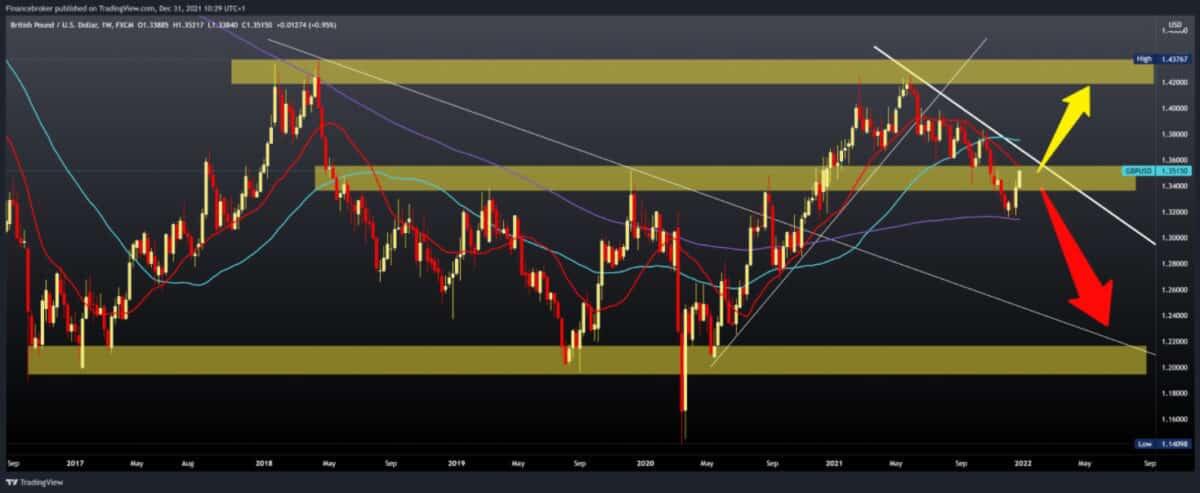
Looking at the annual chart, we see that GBPUSD is starting to withdraw after reaching this year’s high of 1.42500. Pullback stopped at 1.32000 on the MA200 moving average, leading to an instant recovery at 1.35000. At this level, we come across the MA20 moving average, which is an obstacle to previous bullish attempts to return to the bullish trend in the second half of this year. From the upper side of this bearish consolidation, we can draw a trend line and, based on it, determine the next trend movement. The pair is in a very awkward position and cannot predict future GBPUSD movements. We can say that there is more space on the bearish side, especially below the MA200 moving average. While on the bullish side, we have more resistance in the MA20, MA50, and upper trend line.

-
Support
-
Platform
-
Spread
-
Trading Instrument


