EURGBP Technical Analysis: Finding Support at 0.85400 Level
- Last week’s high EURGBP was formed at the 0.85702 level.
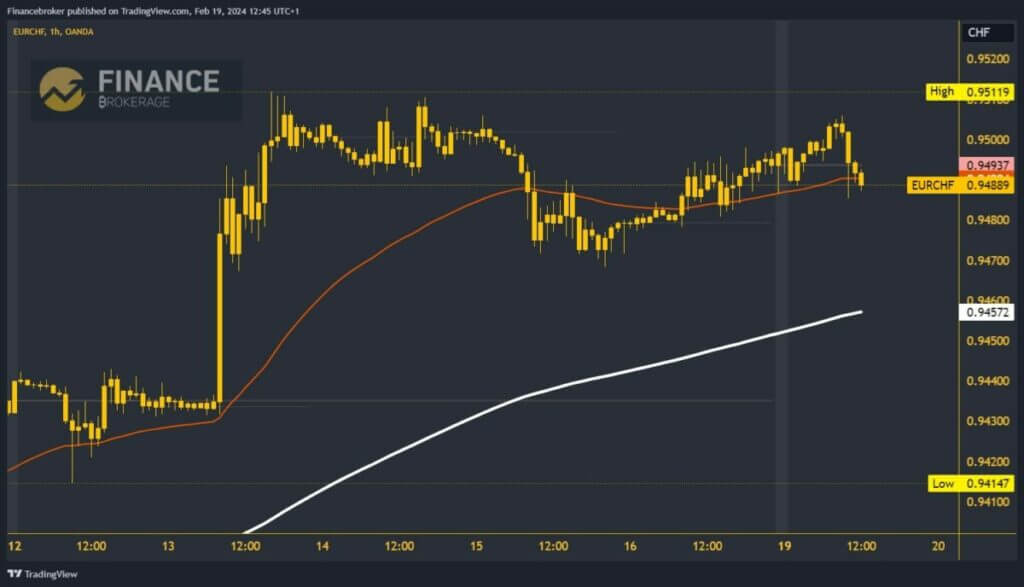
- Last week, we watched the EURCHF jump to the 0.95119 level and form the February high.
EURGBP chart analysis
Last week’s high EURGBP was formed at the 0.85702 level. From that level, the pair is in pullback to the 0.85380 level, where we get support in the EMA200 moving average. After that, we saw a new recovery attempt, which was stopped at the 0.85650 level. After forming a new lower high at that level, the EURGBP started a pullback that continues today.
During the Asian trading session, we saw a drop below the 0.85500 level, and the pullback continued to the 0.85400 level. In that zone, we get support in the EMA200 moving average, which, for now, does not allow us to make a stronger bearish step below. If something like that happens, EURGBP would slide to a new daily low and thus confirm the continuation to the bearish side. Potential lower targets are 0.85350 and 0.85300 levels.

EURCHF chart analysis
Last week, we watched the EURCHF jump to the 0.95119 level and form the February high. After that, the pair moved sideways in the 0.94700-0.95100 range. This week, we continue the sideways movement with the daily high at 0.95060. We stop there, initiate a bearish consolidation, and drop below 0.95000 to 0.94877. The pair could soon form a new daily low, which, with increased bearish momentum, could create a bigger pullback of EURCHF.
Potential lower targets are the 0.94800 and 0.94700 levels. EMA200 moving average is in the zone around 0.94600 levels. For a bullish option, we need a return above the 0.9500 level. Then, we would have to hold above to be able to initiate a bullish consolidation. Potential higher targets are 0.95100 and 0.95200 levels.