Dogecoin and Shiba Inu: Dogecoin is still below 0.06200
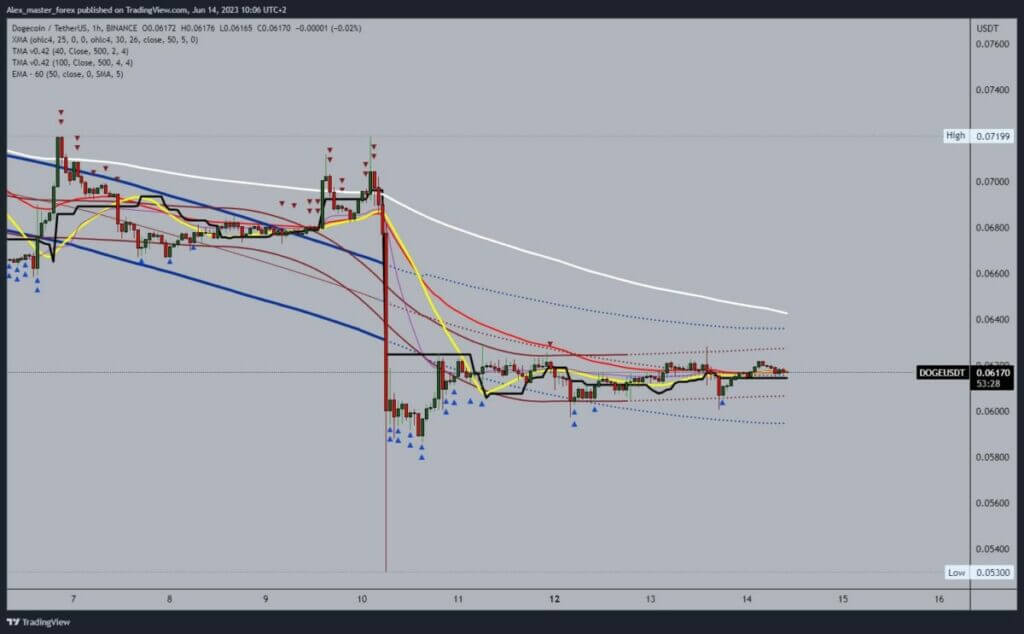
- Dogecoin continues to move in the 0.0600-0.06200 range.
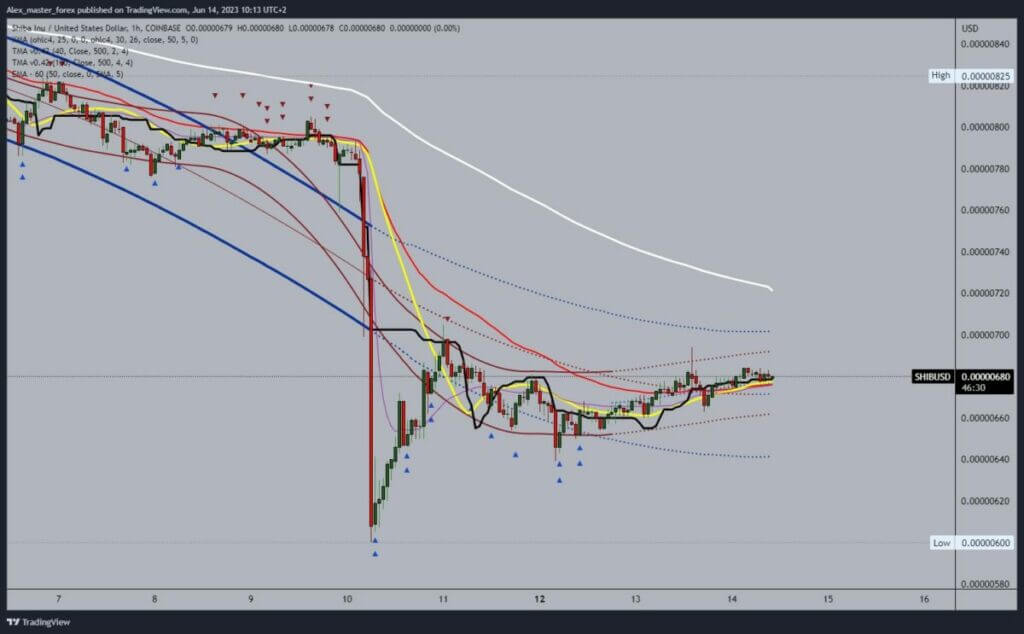
- The Shiba Inu chart is also calm, and the price continues the trend from yesterday.
Dogecoin chart analysis
Dogecoin continues to move in the 0.0600-0.06200 range. Tonight’s FED report has the effect of keeping the market calm until the news is announced. Then we can expect an increase in market volatility and greater price fluctuations. Dogecoin could jump to the 0.06400 level and test the EMA50 moving average there.
To continue to the bullish side, we need a break above and a new bullish impulse to the next level. We need a price drop below the 0.06000 level for a bearish option. Thus, we would fall out of the previous channel movement, and we could see the formation of a new low. Potential lower targets are 0.05800 and 0.05600 levels.

Shiba Inu Chart Analysis
The Shiba Inu chart is also calm, and the price continues the trend from yesterday. We are currently at the 0.00000680 level, and we can say that we are in a mild bullish consolidation. This could push the price to the 0.00000690 level by the end of the day.
The upper key levels for a continuation to the bullish side are 0.00000700 and 0.00000720, along with resistance in the EMA50 moving average. For a bearish option, we need up to 0.00000640 levels. A break below would mean a potential further weakening of the price. Potential lower targets are the 0.00000620 and 0.00000600 levels.


