CREATING TREND LINES
Chapter 2
There are reasons as to why trend lines are drawn on a chart.
What are the reasons?
- The underlying trend’s direction will be seen.
Basically, all markets go upward or downward. Sometimes, their movements go to one general direction – this phenomenon is called a “trend.” In fact, about 30% of the time, markets are in a trending mode. Using averages, channel and trendline are ways to remove data noises. - Support and resistance’s potentials points in the future will be established.
If the trends are continuous, the price levels will reach the trend lines at some point in time. Meanwhile, it will take an effort to change any established trend. Efforts made to change the trend are reflected in the bar chart. On a chart, price bars often recoil from the trend lines. This is also similar to the use of current trend lines. The old trend lines, which originated from the history of a chart, are used to recognize areas with strong resistance and support. This is evidently seen when there’s an overlapping or intersection between a number of significant historical lines. - Directional changes and breakouts will be identified.
Outside the trend channel, a strong move upward or downward will head a reverse direction from the trend or an acceleration or deceleration in the price movements.
So, what are the correct ways to construct trends?
Below are some tips that can serve as guides in constructing trends.
- If there’s an uptrend in the market:
Use the convention if there are two low points and one prevailing high point - If there’s a downward-upward movement in the market:
Use the convention if there are two high points and one prevailing low point.
At this part of our discussion, we will now discuss the difference between an uptrend and downward lines.
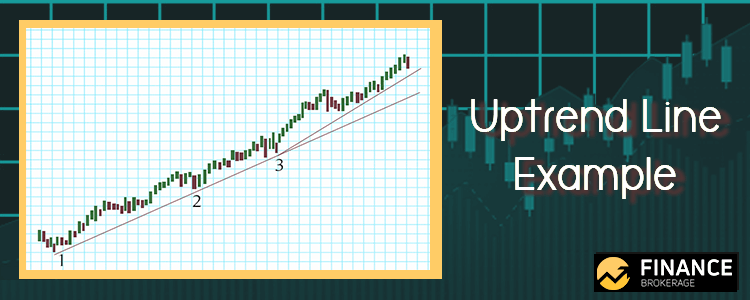
What is an uptrend line?
- This line has a positive slope and is formed through the connection of two or more low points. For it to be considered a positive slope, the second low point must be higher compared to the first line. Remember that there should be three connected points before the line for it to be accepted as a valid trendline.
- This line serves as support and indication on the net-demand in which it increases equally with the rise in price.
- The combined rising price and increasing demand are very bullish. Thus, this presents a tough determination on the buyer’s part. Remember that the uptrend would be intact and solid only if the prices maintain a position above the trend line.
- The decline in net-demand is when there’s a break below the uptrend line. Hence, a change in trend is expected.
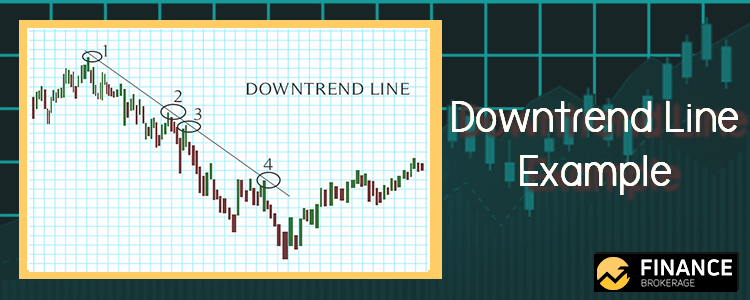
What is a downtrend line?
- This line has a negative slope and is formed through the connection of two or more high points. For it to be considered as a negative slope, the second high must be lower than the first one. Similar to an uptrend line, there should be three connected points before the line for it to be accepted as a valid trendline.
- This line serves as resistance and indication on the net-supply in which it increases equally with the decline in price.
- The combined declining price and increasing supply are very bearish. Thus, this presents a tough resolve on the seller’s part. For this line, take note that in order for the downtrend line to be intact and solid, the price should maintain a position below the downtrend line.
- The decline in net-supply is when there’s a break above the downtrend line. Thus, a change of trend is expected.