


Bitcoin, Ethereum, and Dogecoin and further price recovery
Bitcoin chart analysis
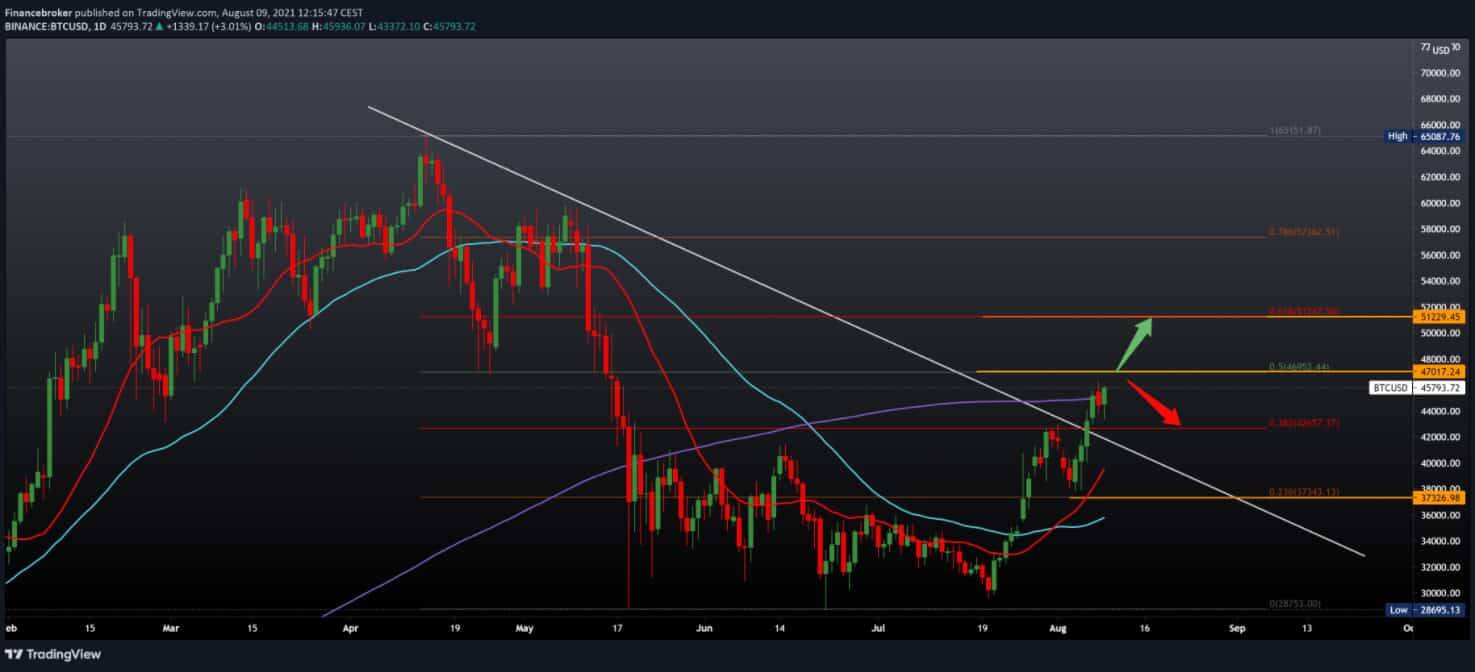
Looking at the chart on the daily time frame, we see that today the price of Bitcoin continues to rise, climbing above $ 45,000 to the current $ 45,850. Price is still testing a 200-day moving average to break that barrier and climb to 50.0% Fibonacci level at $ 47,000. At that level, we need to pay attention because we can expect some resistance. If the price breaks above that level, our next target is the psychological level of $ 50,000, and then the 61.8% Fibonacci level at $ 51,250. As additional support, we also break above the falling line of resistance. On the contrary, an opposite scenario is a bearish option, and for that, we need to lower the price below MA200 and withdraw the price for a new support test at 38.2% Fibonacci level to $ 42655; for the next support below this level, we are looking for a 20 day moving average in a zone of about $ 40,000.

Ethereum chart analysis
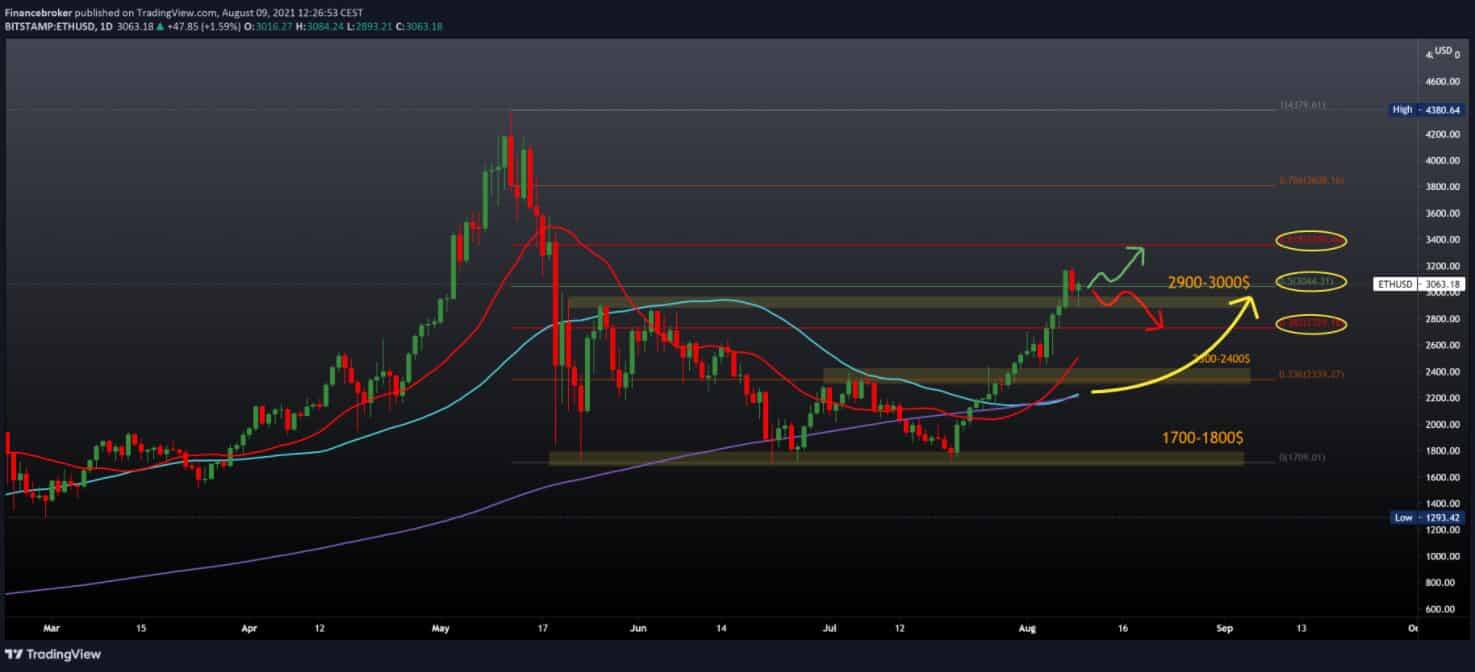
Looking at Ethereum on the daily time frame, we see that after yesterday’s pullback from $ 3200 to this morning’s $ 2900, and then again, the price rise again above $ 3000, to the current $ 3060. We are also testing the 50.0% Fibonacci level at $ 3045, and we can expect a further price increase to 61.8% Fibonacci level at $ 3360, where we were in mid-June. If we consider that we will see a bearish scenario, we need a price withdrawal below 50.0% with negative consolidation and directing the price towards 38.2% Fibonacci level to $ 2730. Following moving averages, we can also expect a smaller pullback of up to a 20 day moving average in the $ 2600 zone, while a 200-day moving average is in the $ 2300-2400 zone.

Dogecoin chart analysis
Dogecoin can be viewed in a four-hour time frame. On Sunday, Dogecoin started bullish, finding support at 0.23350, and then the price climbed to the current 0.25300. Now we can expect the price to climb to 0.26500 instead of yesterday’s resistance which coincides with 23.6% to 0.26230. A break above that level would probably then visit the previous high at 0.28377. The bearish scenario is possible if we again see a weakness in the price of Dogecoin and a retreat below 50.0% Fibonacci level at 0.24920. After such a withdrawal, we can expect a further price drop in the 61.8 Fibonacci level zone to 0.222790, which coincides with the lower trend line of support, which connects the previous lows of 20 July.

Market overview
One bitcoin (BTC) currently worth 25 ounces of gold, bitcoin fell 28.5% from its all-time high against gold — with one BTC worth 35 ounces of gold during Bitcoin’s highest price of nearly $ 65,000 April. One bitcoin was worth 15.5 ounces of gold at the beginning of 2021.
Forex trader Peter Brandt attributed the decline price gold in large liquidations, saying, “This has all the fingerprints of a bank or brokerage house conducting a forced liquidation over a huge lever speculator.”
He noted that the leverage ratio in the gold markets on the Chicago Board of Trade is approximately 15 to 1, which suggests that traders with large financial levers are initiating shares of gold prices.
Analysts at the London-based trading company Citi Index similarly blamed the fall on Monday morning for “sales due to losses in fragile market conditions.”
The number of unemployed in the United States was also a catalyst for the fall in commodity prices last week. The unemployment rate drop more than expected to 5.4% from 5.9%, a new low at the time of the pandemic, according to a report by the Bureau of Labor Statistics released on Friday. Along with the labor market and the economy, the wider U.S. economy continues to recover.
-
Support
-
Platform
-
Spread
-
Trading Instrument

