Bitcoin and Ethereum: The Price of Bitcoin Struggles
- The price of Bitcoin continues to struggle around the $19,000 level.
- Ethereum price is testing the $1270-$1280 support zone for the second day in a row.
Bitcoin chart analysis
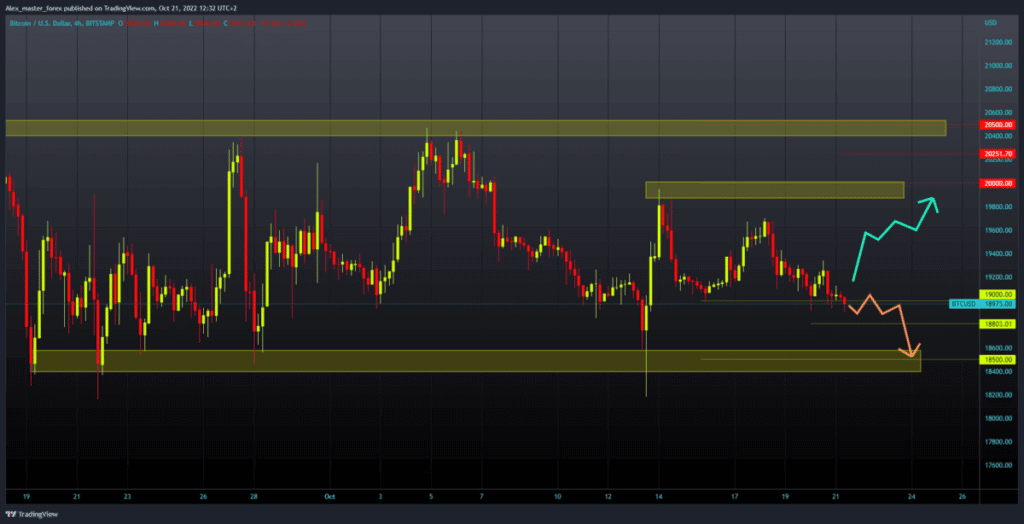
The price of Bitcoin continues to struggle around the $19,000 level. The pressure seems too much for Bitcoin, and we are now seeing a pullback below $18900. A minor recovery takes us back up to $18985.
For a bearish option, we need a continuation of the negative consolidation. The price could first go down to the $18800 support level. If we do not find support there either, the decline could be extended to the $18,500 level. The October low is at the $18182 level. We need a new positive consolidation and recovery above the $19200 level for a bullish option first. If we succeed in that, the next target is the $19,400 level, yesterday’s high.
Then it is necessary to maintain up there and, with a new bullish impulse, continue towards the next high at the $19800 level. We would be very close to $20,000 there, which could attract the price of Bitcoin, resulting in a test of that level. A potential higher target is $20,500 at the October resistance zone.

Ethereum chart analysis
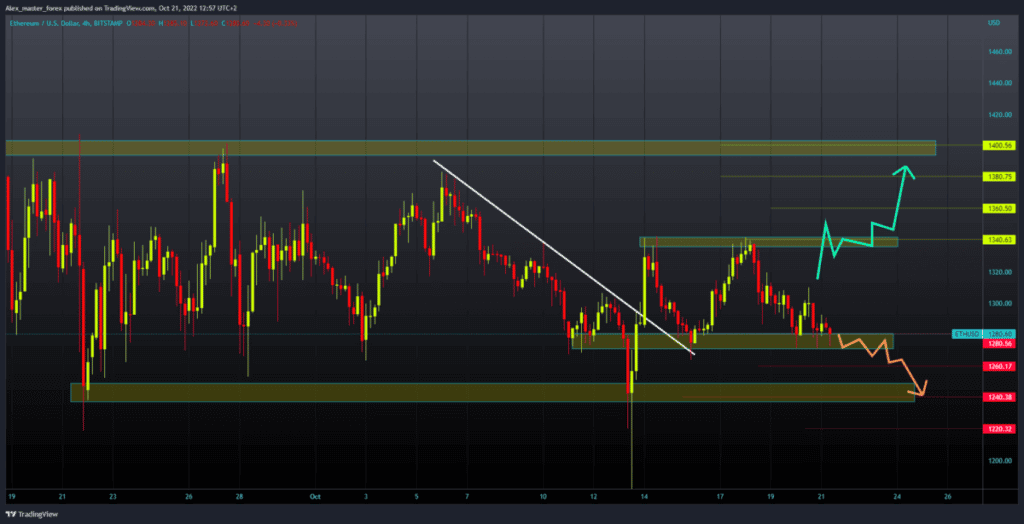
Ethereum price is testing the $1270-$1280 support zone for the second day in a row. If the pressure continues, we could see a drop below and the formation of a new ten-day lower low. We could look for the first support at the $1260 level, and if we fail to do so, we will see a continuation of the price drop.
Potential targets are $124 and $1220 levels. For a bullish option, we need a new positive consolidation and a return to the $1300 level. Then we must try to stay up there and continue the recovery with the next bullish impulse. Our next resistance is the $1340 level, and a break above it would significantly strengthen the bullish recovery to the $1400 level.


