Bitcoin and Ethereum: Ethereum jumps to $1976 this morning
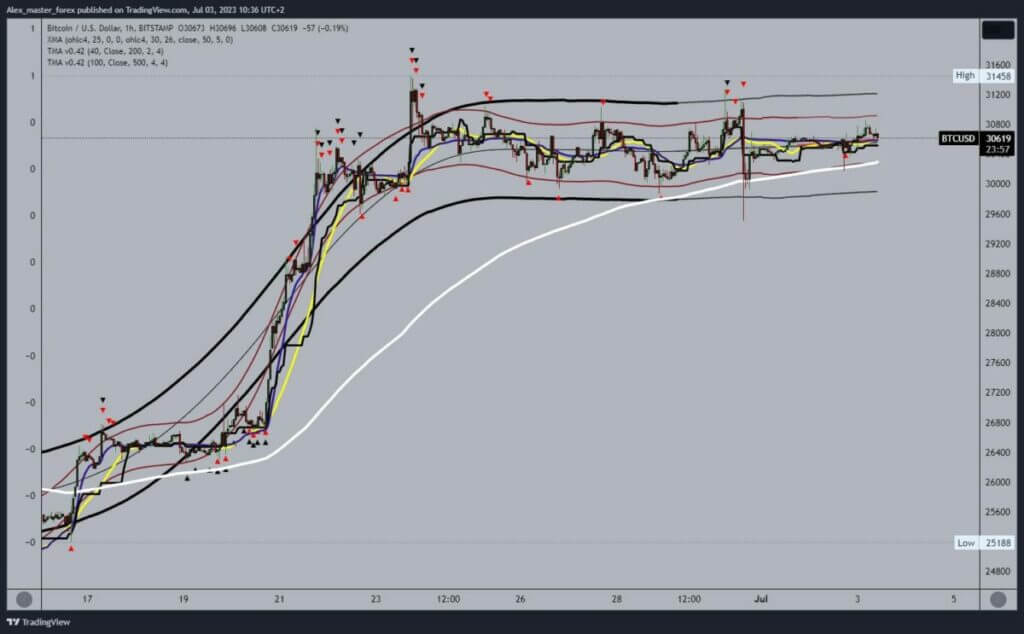
- In the past ten days, the price of Bitcoin has remained constant above the $30,000 level.
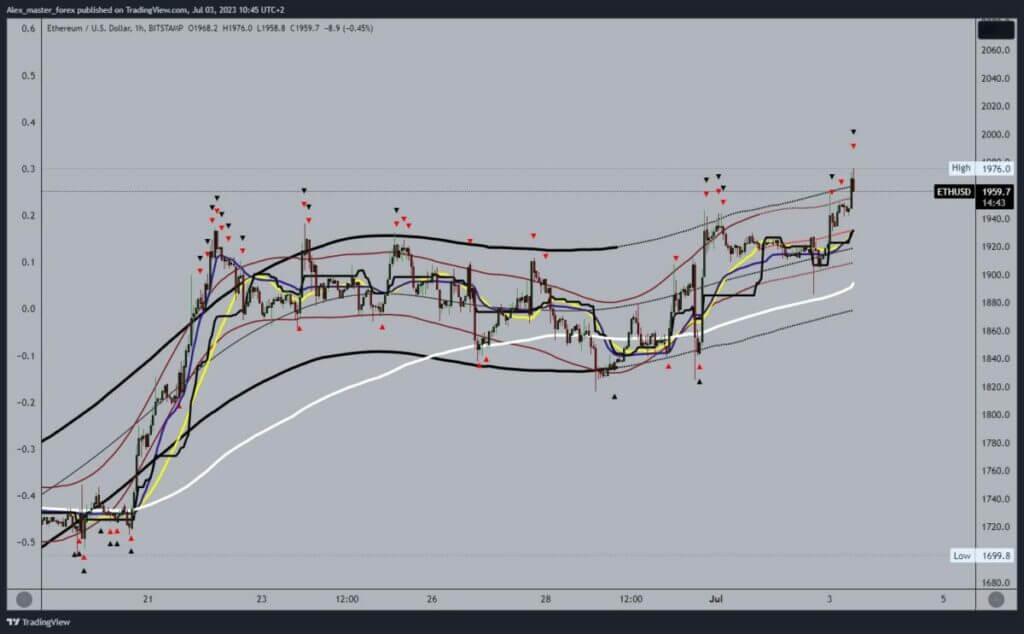
- The price of Ethereum jumped to a new two-month high at the $1976 level this morning.
Bitcoin chart analysis
In the past ten days, the price of Bitcoin has remained constant above the $30,000 level. On Friday, we had a bearish impulse and a drop to the $29,500 level. We stayed down for a short time, and the price soon began to recover and returned above the $30,000 level. Yesterday we jumped to the $30800 level, and now we are stabilizing around the $30600 level. Bitcoin price continues to find support in the EMA50 moving average, which has come very close to us, and we can expect a bigger price move soon.
We need a break above the $31000 level for a bullish option. Next, we must stay up there to test the 31200 resistance level. Potential higher targets are $31400 and $31600 levels. We need a drop below the $30000 level and below the EMA50 moving average for a bearish option. Thus, we would move into negative territory, which would mean a possible fall and pullback of the price. Potential lower targets are $29800 and $29600 levels.

Ethereum chart analysis
The price of Ethereum jumped to a new two-month high at the $1976 level this morning. Over the weekend, the price found support at $1900 and started a bullish consolidation. The first impulse raised the price to the $1,950 level before consolidating around the $1,940 level. Then came the second impulse that formed today’s high.
We are currently seeing a minor pullback to the $1960 level, and now we are hoping for new support in the zone around the $1950 level before continuing to the bullish side. Potential higher targets are the $1980 and $2000 levels. We need a negative consolidation and a drop below the $1940 support level for a bearish option. After that, we could expect to see further price pullbacks. Potential lower targets are $1920 and $1900, with additional support in the EMA50 moving average.


