


Bitcoin and Ethereum: Bitcoin falls to the $28980 level
- Yesterday’s attempt by the price of Bitcoin to make a concrete step to the bullish side was stopped at the 30350 level.
- Over the weekend, Ethereum’s price remained under pressure below the EMA50 moving average.
Bitcoin chart analysis
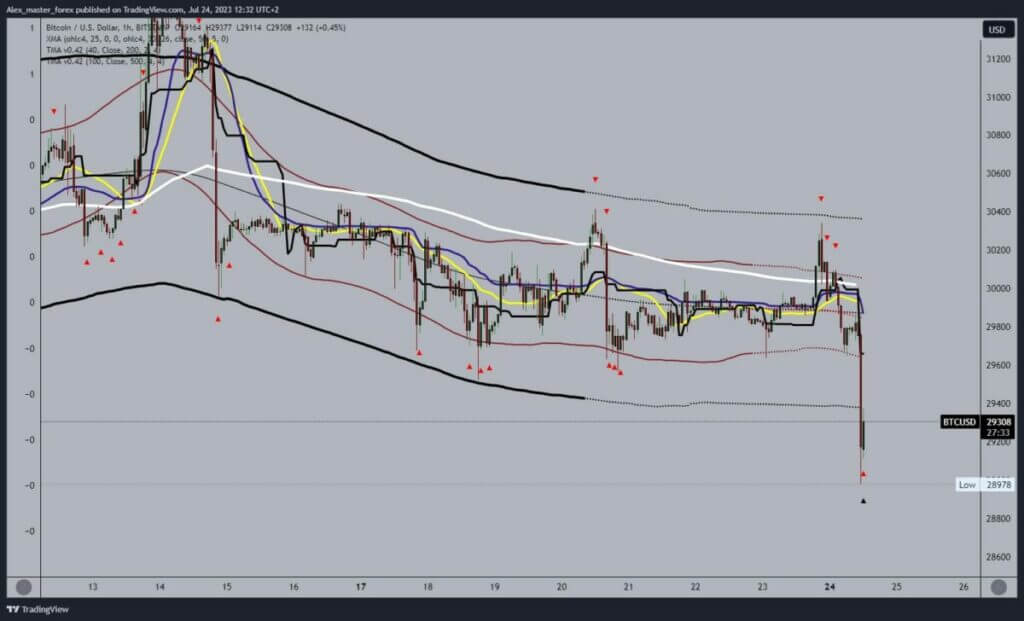
Yesterday’s attempt by the price of Bitcoin to make a concrete step to the bullish side was stopped at the 30350 level. We start bearish consolidation from there, pulling back below $30000 and the EMA50 moving average. Then, we get support in the $29,600-$29,800 zone, and later we see a breakout below and a price drop to the $28,978 level. Thus, a new monthly low price was formed.
We need a new positive consolidation and price movement above the $29400 level for a bullish option. Then, we need to stay above that and to start the continuation of the recovery with a new impulse. Potential higher targets are $29600 and $29800 levels.

Ethereum chart analysis
Over the weekend, Ethereum’s price remained under pressure below the EMA50 moving average. Yesterday we had an attempt to start a bullish option, but it was stopped at the $1900 level. From there, Ethereum starts a new pullback and today falls to the $1833 level, thus forming a two-week low.
For a bearish option, we need a continuation of the negative consolidation. Potential lower targets are $1820 and $1810 levels. We need a positive consolidation and price movement above the $1850 level for a bullish option. Then, we need to try to stay above that, and with a new impulse, we would start the continuation of the recovery. Potential higher targets are $1860 and $1870 levels.


