AUDUSD and AUDNZD: AUDUSD is holding above 0.64300
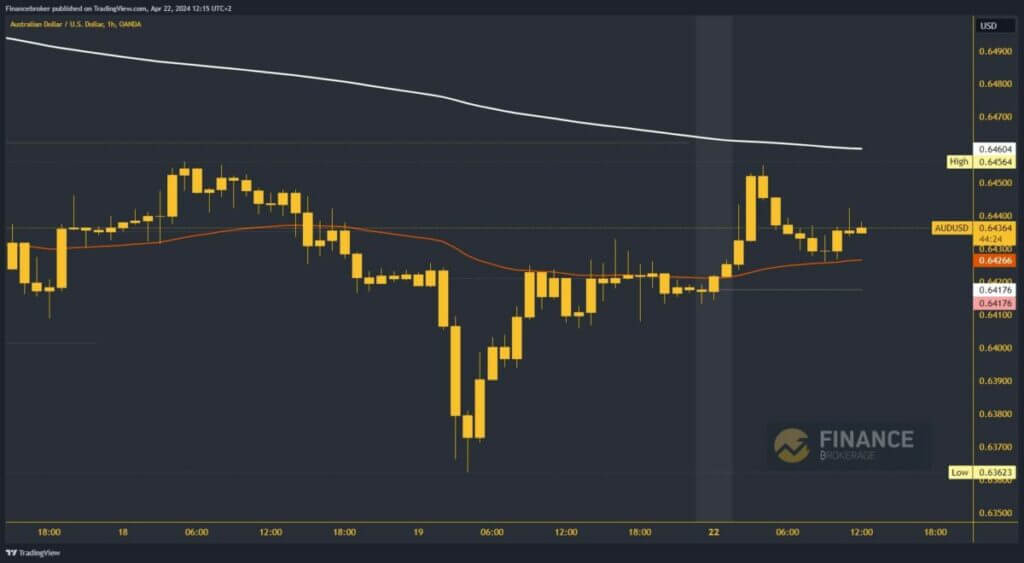
- During the Asian trading session, AUDUSD rose to 0.64564 levels.
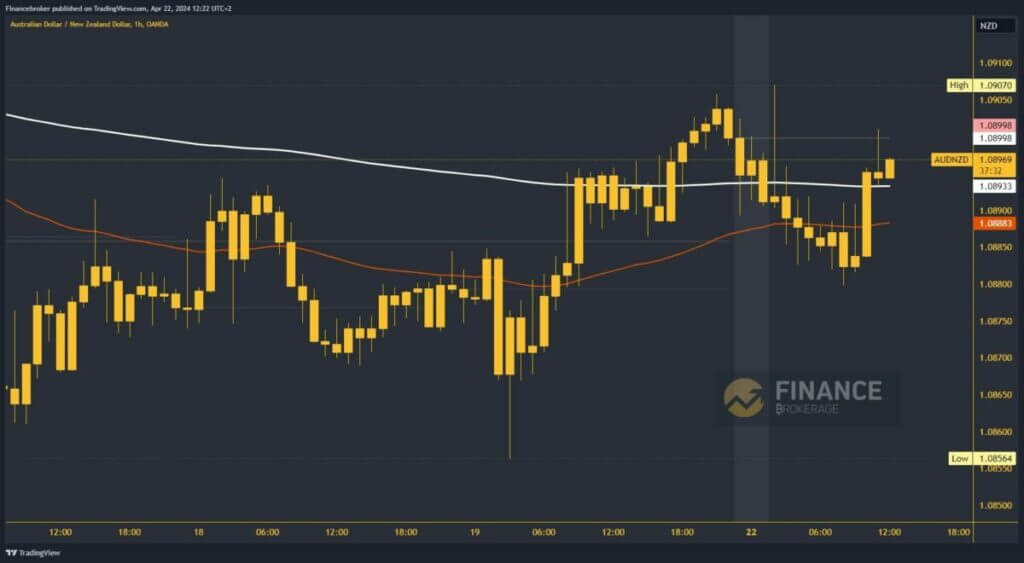
- During the Asian trading session AUDNZD was in retreat from 1.09000 to 1.08800 level.
AUDUSD chart analysis
During the Asian trading session, AUDUSD rose to 0.64564 levels. We stopped there, followed by a pullback to support at the 0.64300 level. Here, we come across the EMA50 moving average, which stops the decline and provides support, turning us back to the bullish side. This triggers a new bullish consolidation, and we are now above the 0.64400 level.
We need a continuation of this movement to once again find ourselves in a position to approach the EMA200 moving average at 0.64600. We need a pullback below the EMA50 and the 0.64300 level for a bearish option. With that, we are turning towards 0.64200 and testing the weekly open price. A longer hold in that zone will force the AUDUSD to slide below to the bearish side. Potential lower targets are 0.64100 and 0.64000 levels.

AUDNZD chart analysis
During the Asian trading session AUDNZD was in retreat from 1.09000 to 1.08800 level. After which we get support at that level in the EU session and go back up to the 1.09000 level. We are now trying to hold above the EMA200 and 1.08950 levels. HERE we hope for new support to continue to the bullish side. Potential higher targets are 1.09100 and 1.09200 levels.
We need a new pullback down to support a bearish option at the 1.08800 level. Retesting that zone could easily lead to a break below to a new daily low. This gives us confirmation of the bearish option for further withdrawal. Potential lower targets are 1.08750 and 1.08700 levels.


