ApeCoin and Akita Inu: Akita Inu tests support again
- ApeCoin price continues to move sideways in the 2,850-2,950 range.
- The Akita Inu price continues to put pressure on the support zone.
ApeCoin chart analysis
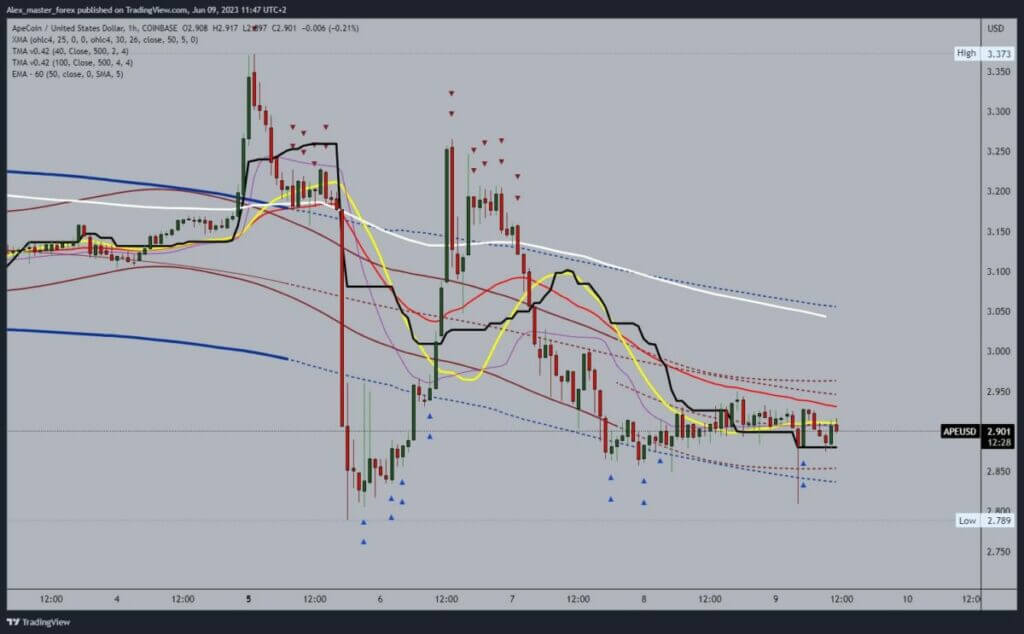
ApeCoin price continues to move sideways in the 2,850-2,950 range. The market has calmed down after a volatile Monday, and everything is calm now. Looking at this chart, we need a positive consolidation and a jump above the 2,950 level. Then we need to stay up there before we continue with the recovery.
Potential higher targets are 3,000 and 3,050 levels. Additional resistance at the 3,050 level is the EMA50, and we will need a move above it if we want to see further recovery. We need a negative consolidation and a drop to the 2,800-2,850 support zone for a bearish option. With the breakout below, we will see a new lower low forming. Potential lower targets are 2,750 and 2,700 levels.

Akita Inu chart analysis
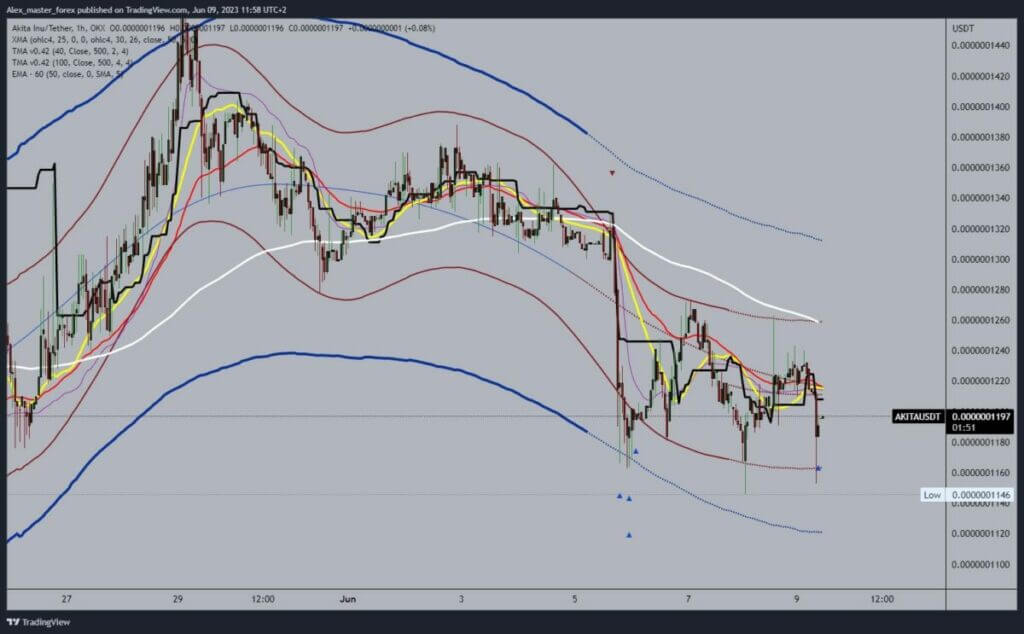
The Akita Inu price continues to put pressure on the support zone. We continue to test the 0.0000001160-0.0000001180 support zone. We are returning to this zone for the third day in a row. Now we see a new bullish impulse and a recovery to the 0.0000001200 level. We need a break above and hold there if we want to see the recovery continue.
Potential higher targets are 0.0000001220 and 0.0000001240 levels. We need a negative consolidation and a drop below the 0.0000001160 level for a bearish option. In that case, the price would continue to slide until a new lower low is formed. Potential lower targets are 0.0000001140 and 0.0000001120 levels.


