What is a timing indicator in Forex?
Forex traders use various technical indicators to invest their money wisely. These mathematical tools guarantee profits when used well. Conversely, their ignorance and misuse lead to losses. The use of technical indicators is vital for all Forex investors. One of these indicators is the timing indicator. So what is a timing indicator in Forex, and why is it important?
What is a timing indicator in Forex?
There are about twenty technical indicators commonly used in Forex. Some are very complex and require the investor to have a good knowledge of mathematical formulas.
Others are easy to understand and apply. However, it is not necessary to know them all to invest in Forex.
Market timing studies the evolution of a market (or an asset) in order to determine when an investor should intervene to generate the maximum profit.
This practice applies to assets as well as indices or a market. One of the common methods is high-frequency trading, which is based on the exploitation of market algorithms. This article reviews the concept of market timing.
What is a timing indicator in Forex – objectives of market timing

Market timing is an attempt to predict the market’s direction through technical indicators or economic data, including stock market indicators and growth prospects.
This data theoretically indicates when the investor should intervene, buying, selling, or taking a forward position. Market timing can be assimilated to an arbitrage operation on net asset value.
Thus, if a listed security is moving downwards vis-à-vis its book value, the market timing signals to the market operator that it is necessary to acquire, and vice versa.
What is a timing indicator in Forex – MBFX indicator?
One of the most powerful indicators for timing in Forex is the MBFX timing indicator. It’s a very helpful trading tool for Forex traders that gives insight into the best timings for their trades.
Also, it enables them to base their trades on informed decisions and increases the odds of successful trading. The MBFX indicator is based on the MACD indicator that spots the differences between moving averages.
Combining oscillator signals with moving averages, the MBFX helps you decide when to enter and exit your trades.
The MBFX timing indicator displays various time frames for trading. It is applicable for short trades and long trades. It helps traders and investors in the currency market see currency pairs’ long-term and short-term trends simultaneously.
With this tool, traders can easily spot potential exits and entry points. Additionally, it also indicates if there are divergences between the two-time frames.
It also indicates the opportunities for entering the trades before the asset price reaches the target level.
For example, the momentum in the market has changed upwards in case the moving averages indicator line is under zero. But the line crosses above zero for a certain period. That
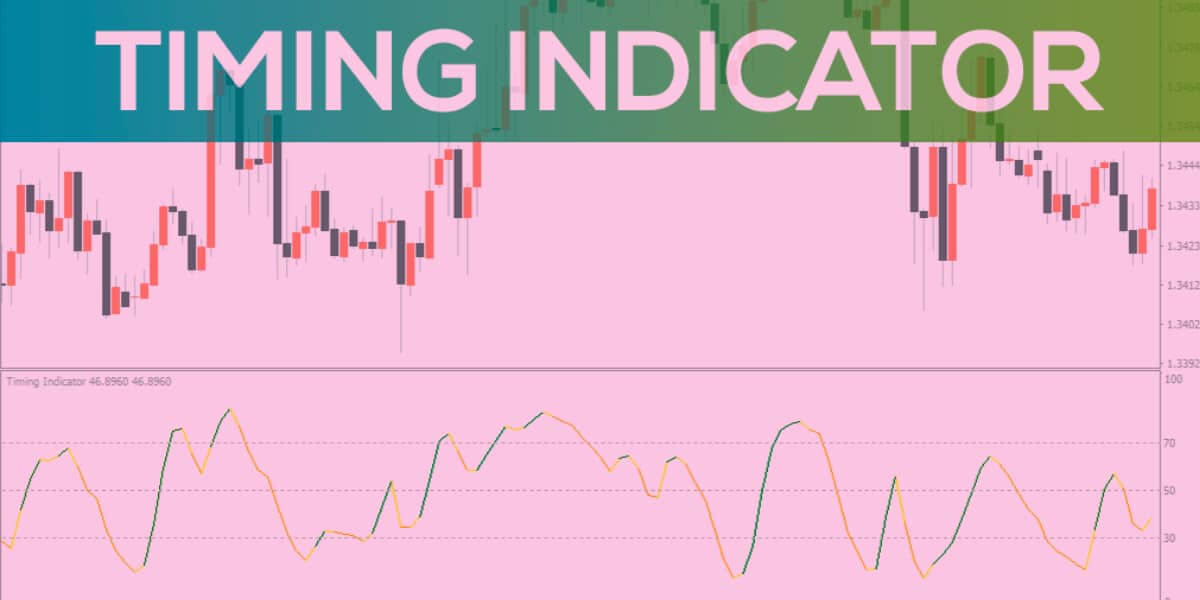
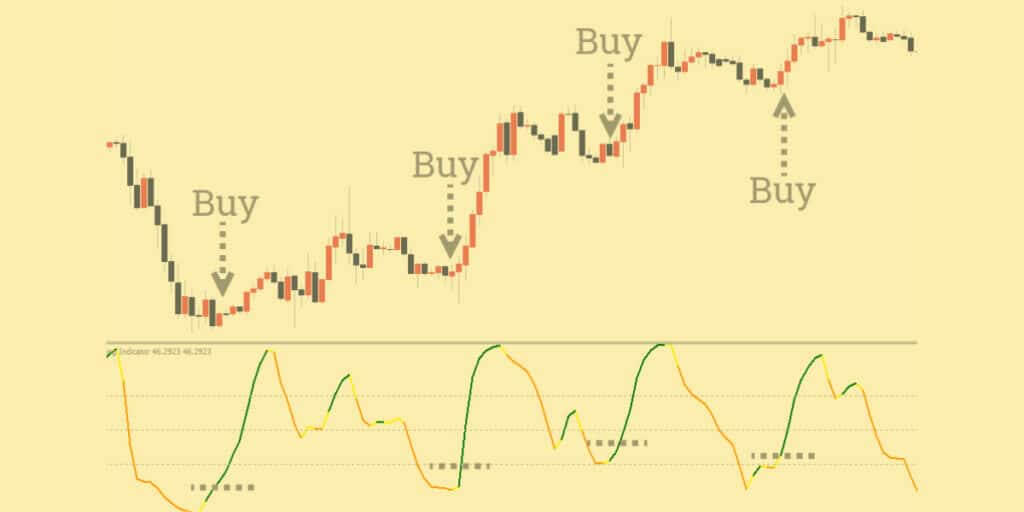
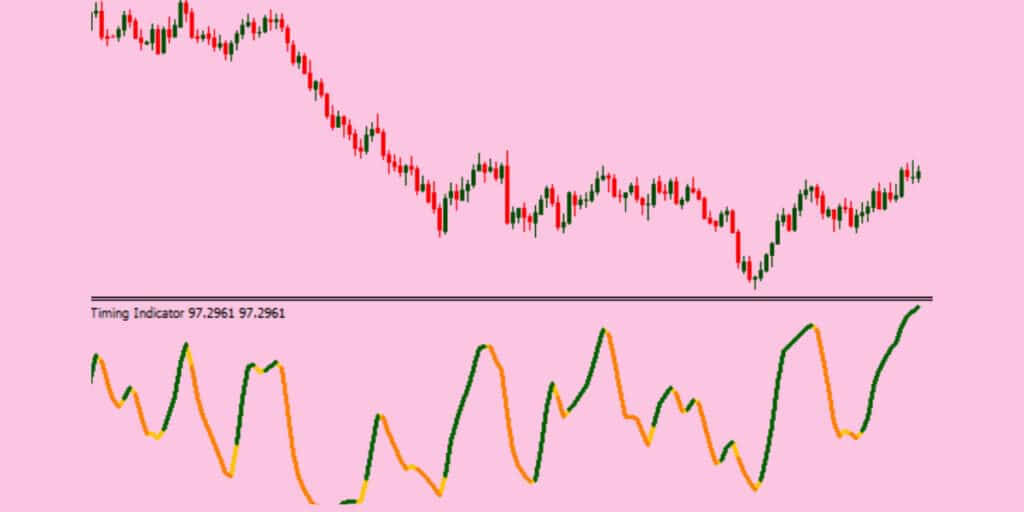
Timing indicator MBFX gives you the data for micro trends. A bullish micro trend is in green color.
The orange shows a downtrend, while the yellow represents a transitional time frame.
It also provides visuals such as trendy bars, arrows, trend lines, and price labels.
These help traders spot opportunities more accurately. MBFX encompasses several parameters that are customizable according to traders’ preferences. You can set up alerts for a considerable price change or specific periods.
This timing indicator works by ensuring that relevant data are featured on the chart, enabling maximal control over the trades. Combining this timing indicator with Bollinger bands and other band indicators is advisable.
What is a timing indicator in Forex – Methods of trade with MBFX

You should go for a buying option if the Bollinger is in an uptrend mode while the middle line is rising and the overall intraday trend is bullish. In this case, you should also pay attention that the last hour close is in green on the MBFX indicator chart.
If the intraday trend shows a bearish signal, you should go for a sell trade. Additionally, the Bollinger band should be bearish, and the last hour close is in orange on the MBFX indicator chart.
Signals are generated when a movement appears or when a movement is absent. The indicator’s line location, color, and direction determine the current market movement. If a certain candle shows bullish market conditions, a buy trade should be open. If there is a downtrend, it’s time to sell.
MBFX represents the trading algorithm developed for trend trading purposes. The indicator performs the calculation signaling the absence or presence of the trend and its strength. It also determines if the market is on an overbought or oversold side.
It’s an indicator useful for any time frame and any currency on Forex. It’s useful for applying it to many trading strategies. Its main purpose is to make more accurate other trading signals on the market.
Other Indicators to combine with Time Indicator in Forex
The other technical indicators mentioned above are very useful in Forex. Most brokers and traders use it almost systematically.
- Stochastic oscillator and momentum
The stochastic oscillator is an indicator that specifies the overbought or oversold conditions of parity over a certain period. This calculation, which is expressed as a percentage, is presented on a graph, and the divergences between the lines of which are analyzed. It is the interpretation of the information provided by these lines that indicate the best trade signal on which the investor relies to sell or buy.
Momentum is the ideal indicator to measure the speed of variation of a given course over several periods. Traders usually use 12-25 day momentums to get the most precise and accurate comparative ratio.
Some extend the momentum calculation over 1 to 200 days. The momentum interpretation is simple: if it is low, the analyzed cross is underbought, and if it is high, the cross is overbought.
- Bollinger Bands
The latest financial market trading indicator is among the best. It’s the Bollinger bands indicator. Its name comes from its creator John Bollinger. This indicator enables you to determine the first signs of a trend.
There are three types of this indicator: the top, the middle, and the bottom band.
The space between the lower and upper bands shows volatility. Bollinger band enables excellent chart reading and represents a real pro-trader analytics indicator.
The 3 forex trading sessions
Now that we have answered the question of what is a timing indicator in Forex, we can turn to other factors for determining entry/exit points.
Besides the timing indicator, you should always refer to the trading sessions to predict the best time to enter and exit the trades.
To better trade on the Forex, it is useful to know the periods of activity of the different geographical areas.
In particular, this makes it possible to anticipate peaks and troughs in volumes and volatility.
The Asian session (Tokyo)
With the weekend over, liquidity returns to Forex, and Asian markets are naturally the first to spring into action. In reality, activity in this part of the world is concentrated in the Japanese capital markets, which are active from midnight to 6 a.m. Greenwich Mean Time (GMT).
However, many other quite influential countries are present at this session, including China, Australia, New Zealand, and Russia. If we take into account the distance between all these markets, we understand better why the opening and closing of the Asian session exceeds the Japanese hours. The Asian market tends to be active from 11 p.m. to 8 a.m. GMT instead to accommodate the hours of activity of these markets.
The European session (London)
Later in the trading day, just before the Asian Stock Exchange closes, European sessions take over the currency market. In this time zone, Forex is very lively and includes many major financial markets that would undoubtedly deserve the title of the symbolic capital of Forex.
However, it is London that has the honor of setting the parameters for the European session. Official London session hours are 7:30 a.m. to 3:30 p.m. GMT.
But, once again, the period of effective activity is extended by the presence of other markets, including Germany and France, before the official opening in the United Kingdom.
At the end of the session, it is lengthened because the volatility persists after the close during the fixing. The European session, therefore, generally lasts from 7 a.m. to 4 p.m. GMT.
The American session (New York)
When Americans hit the forex market, Asian markets had already been closed for several hours. But European traders were only halfway through their day. The Western Block session is dominated by activity from the United States, with little participation from Canada, Mexico, and a few South American countries.
This is why it is not surprising to see activity in New York representing a spike in volatility and trading volumes.
Due to a considerable gap between the closing of the US markets and the opening of the Asian session, a sudden drying up of liquidity marks the end of the American session at 8 p.m. GMT.


