USDRUB and EURUSD daily analysis
USDRUB chart analysis
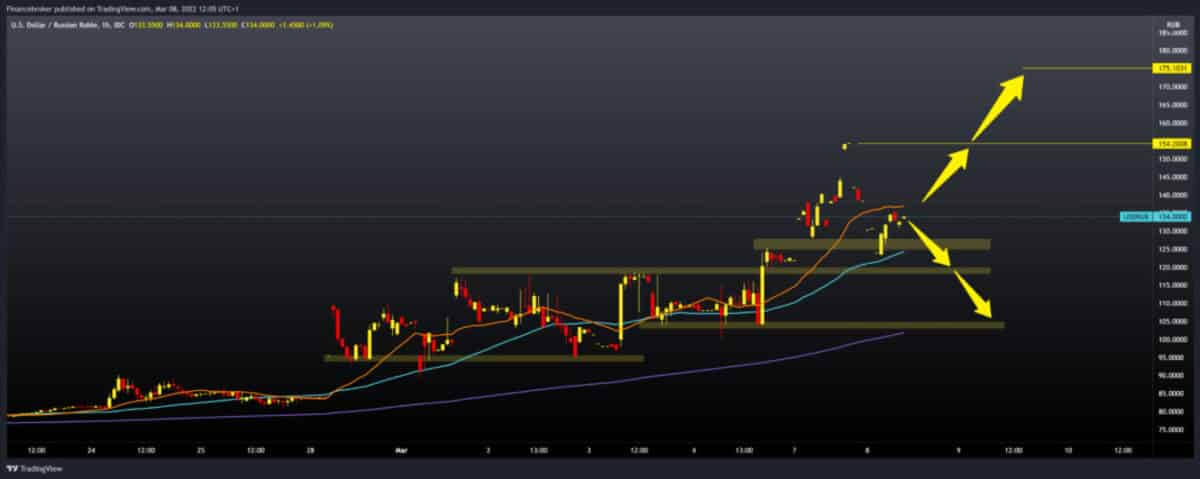
The Russian ruble fell to a new historical low of 154,200 yesterday. Pair USDRUB did not stay at that level for long, and very quickly, there was a withdrawal to 125,000, where USDRUB found support. We now have consolidation in the 130,000-135,000 zone. Looking at moving averages, we see a pair between MA50 support and MA20 resistance, and we need a break above to continue the bullish trend. We need growth above 140,000 in order to be able to threaten the previous high of 154,200 and form a new historical high. If the growth of USDRUB continues as in the previous week, our target zone is 170,000-175,000.

The crisis in Ukraine, the military action of Moscow and the severe sanctions of the EU and the USA against Russia threaten to cause unforeseeable economic consequences worldwide, and above all in Russia and the European Union. On the other hand, the crisis in Ukraine led to the collapse of stock exchanges in the EU, which fell by as much as 20% due to the enormous jump in gas, oil and wheat prices, which experts predict could have a catastrophic impact on member states’ economies. This crisis has also affected the leading European banks, which have been seriously shaken and are recording a big decline.
The gas price on the stock exchange in Europe recorded a dizzying rise for the fourth day in a row, exceeding today the level of 3,600 dollars per 1,000 cubic meters, which is an all-time record, according to data from the London Stock Exchange. The gas price on the stock exchange in Europe recorded a dizzying rise for the fourth day in a row, exceeding today the level of 3,600 dollars per 1,000 cubic meters, which is an all-time record, according to data from the London Stock Exchange. These are the highest prices of “black gold” since 2008. “If the West bans most of Russia’s energy exports, it would be a big shock to global markets,” said Ethan Harris, chief economist at Bank of America.
He estimates that the loss of five million barrels from Russia could lead to a doubling of the price of oil to 200-250 dollars per barrel, but also a reduction in world economic growth.
Unfortunately, the price of wheat has doubled. On March 4, 2021, it was $ 6.5, while on March 4, 2022, the price was $ 13.4.
EURUSD chart analysis
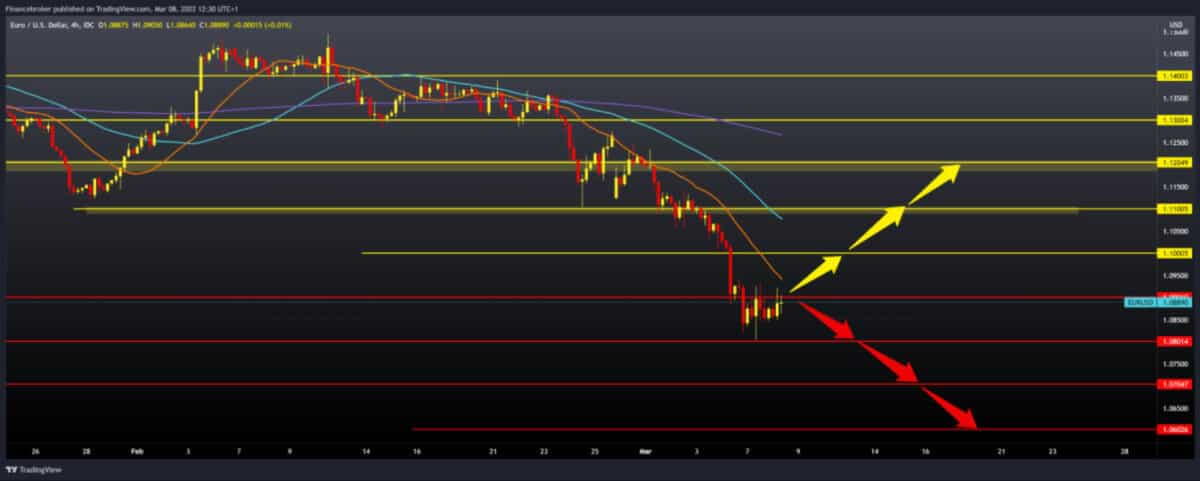
Pair EURUSD was in consolidation 1.08500-1.09000 yesterday. At one point, the pair fell to 1.08050, forming a new low this year. Today, EURSUD recorded a smaller profit, rising to the current 1.09000. For a more concrete continuation, we need growth above 1,09500 because then we get support in the MA20 moving average.
Bullish scenario:
-
We need new positive consolidation and growth of EURUSD to 1.10000.
-
In the zone around 1.10500, we encounter potential resistance in the MA50 moving average.
-
If further bullish growth of EURUSD continues, our next resistance is at 1.12000, then 1.12500, where we find the MA200 moving average.
Bearish scenario:
-
We need to continue the negative consolidation and retreat below 1.08500, to re-test the previous low to 1.08000.
-
Break below us to 1.07000, the next potential support, and if bearish pressure continues, we can expect even lower EURUSD on the chart.
-
Any new news and events in Ukraine and sanctions against Russia will definitely affect the European currency.

-
Support
-
Platform
-
Spread
-
Trading Instrument


