USDCHF and USDJPY: USDJPY pulls back below the 145.50 level
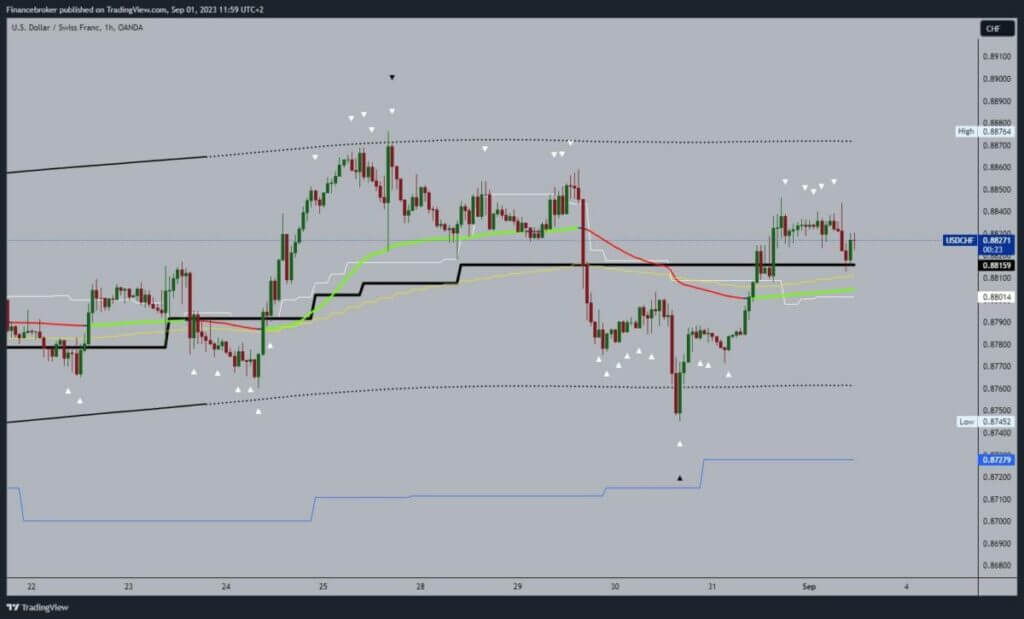
- In the past two days, we have seen a bullish trend of USDCHF from 0.87400 to 0.88500 levels.
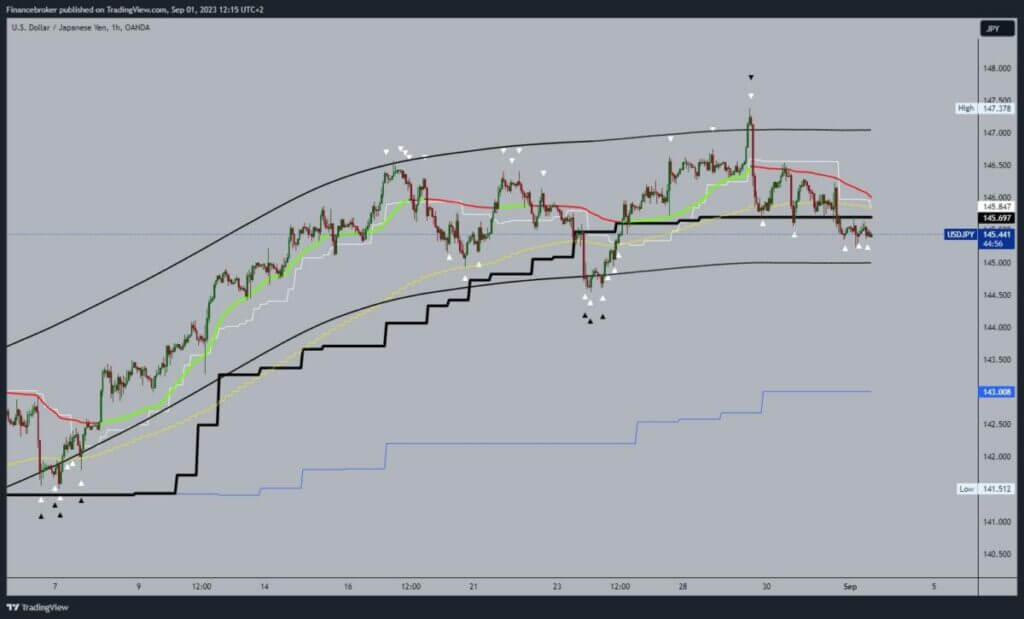
- Pair USDJPY is in a bearish trend with 147.37 levels.
USDCHF chart analysis
In the past two days, we have seen a bullish trend of USDCHF from 0.87400 to 0.88500 levels. During the Asian session, the bullish trend stopped and retreated to the 0.88130 level. For now, we have support at that level and are moving up to the 0.88280 level. If this small bearish trend continues, a break below the 0.88100 level could occur.
Additional support at that level is the EMA50 moving average. Potential lower targets are 0.88000 and 0.87900 levels. We need a positive consolidation and a new jump above the 0.88400 level for a bullish option. Then we would have to hold up there if we want to see a continuation to the bullish side. Potential higher targets are 0.88500 and 0.88600 levels.

USDJPY chart analysis
Pair USDJPY is in a bearish trend with 147.37 levels. This high was formed on Tuesday, initiating a pullback to the 145.40 level. During the Asian trading session, the pair hovered around 145.50 levels. The dollar still remains under pressure in that zone, which could lead to a breakout below and the formation of a new lower low. Potential lower targets are 145.00 and 144.50 levels.
We need a positive consolidation and a move up to the 146.00 level for a bullish option. Thus, we would climb above the support zone and turn a possible recovery. We would also receive support in the EMA50 moving average, which could have a positive impact on the future trend. Potential higher targets are 146.50 and 147.00 levels.


