USDCHF and USDJPY: USDJPY on the way to 148.00 level
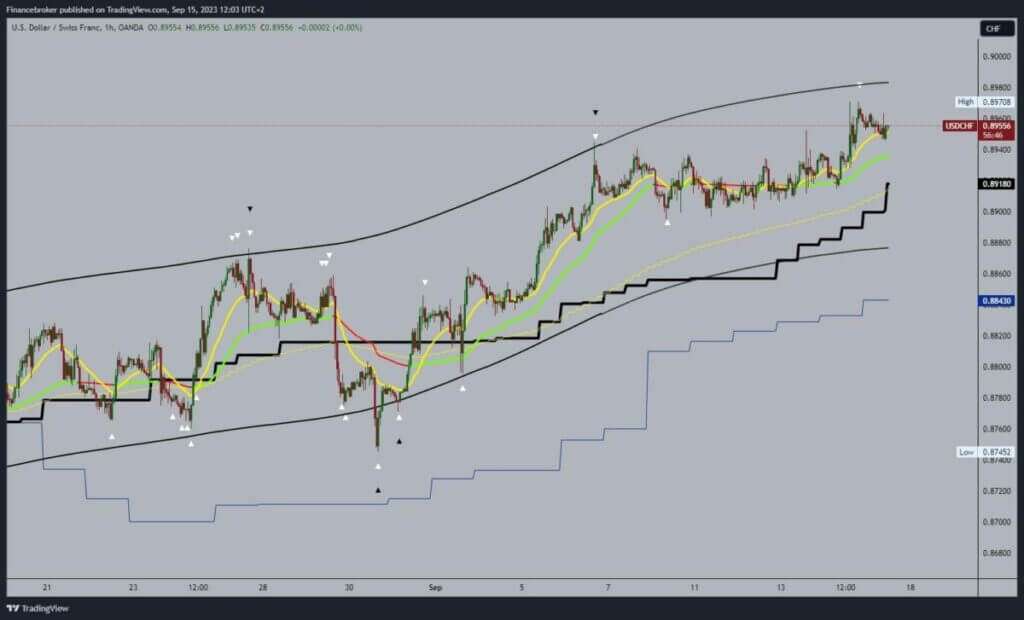
- Yesterday, we saw the formation of a new high at the 0.89700 level.
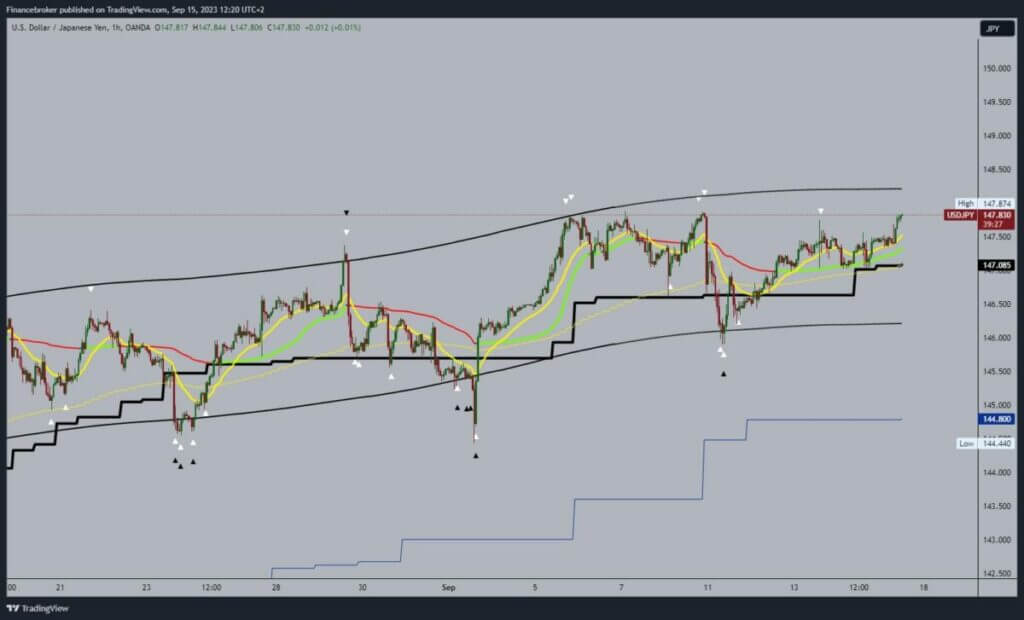
- The pair USDJPY was in a bullish trend this week from 145.90 to 147.85 levels.
USDCHF chart analysis
Yesterday, we saw the formation of a new high at the 0.89700 level. After that, during the Asian trading session, we saw a pullback and a drop to the 0.89460 level. If we see a break below, then we can expect the pair to start a further pullback to the next support level. Potential lower targets are 0.89300 and 0.89200 levels. Additional support in the zone around 0.89200 was in the EMA50 moving average.
We need a positive consolidation and a breakout of the previous high for a bullish option. Then, we need to hold above and proceed to the bullish side from there. Potential higher targets are 0.89800 and 0.90000 levels.

USDJPY chart analysis
The pair USDJPY was in a bullish trend this week from 145.90 to 147.85 levels. During the Asian trading session, the pair consolidated around 147.50 levels. After that, we saw a bullish impulse and a break above the previous consolidation. Today, we could expect to see growth and testing of the 148.00 level. Potential higher targets are 148.25 and 148.50 levels.
We need a negative consolidation and pullback below the 147.50 support level for a bearish option. In the continuation, we would go down to the 147.00 level. A break below this support could mean we start a stronger bearish pullback. Potential lower targets are 146.50 and 146.00 levels.


