

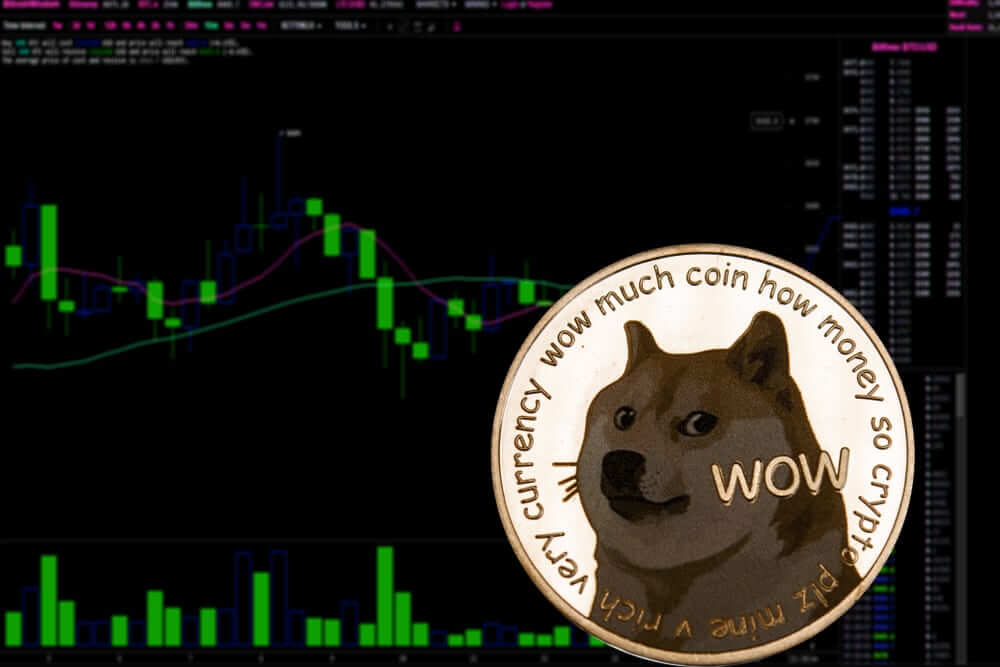
Understanding Dogecoin: From 0.079200 to 0.07800
- The price of Dogecoin managed to reach the 0.079200 level yesterday and formed a weekly lower high.
- The Shiba Inu price fell to a new two-week low yesterday at 0.00000877.
Dogecoin chart analysis
The price of Dogecoin managed to reach the 0.079200 level yesterday and formed a weekly lower high. Additional pressure in that zone created the EMA200 moving average, and the price failed to break through and hold above.
After that, we see a pullback and descent of Dogecoin to the 0.07830 level. Today, we are looking at bearish consolidation and expect a retest of yesterday’s support zone in the 0.0760-0.07800 range.
New pressure on that zone could make a breakthrough below and form a new lower low. Potential lower targets are 0.07750 and 0.07725 levels. For a bullish option, we need to return to the 0.07900 level and test the EMA200 again.
By moving above those resistance levels, we would find ourselves on the positive side, from which the price could start a bullish consolidation. Potential higher targets are 0.07950 and 0.08000 levels.

Shiba Inu chart analysis
The Shiba Inu price fell to a new two-week low yesterday at 0.00000877. After that, we were a shy attempt at recovery, which was stopped at the 0.00000893 level. There, we encounter resistance and initiate a negative consolidation and pullback to the 0.00000880 level.
Under such pressure, the price could break below and form a new low. Potential lower targets are the 0.00000875 and 0.00000870 levels.
We need to break this bearish channel for a bullish option and climb to the 0.00000895 level. There, we would get much closer to the EMA200 moving average. A new bullish impulse could quickly bring about a reversal and trigger a stronger bullish recovery. Potential higher targets are the 0.00000900 and 0.00000905 levels.


