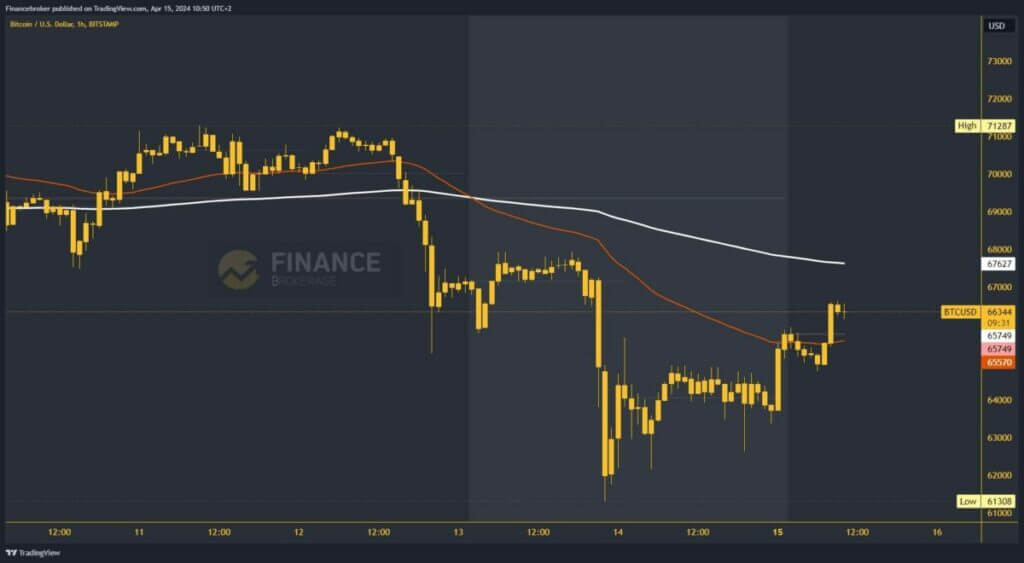
The price of Bitcoin retreated to $61308 on Saturday
- On the chart of Bitcoin, we see how the greater volatility started on Friday with the drop below the $70,000 level.
Bitcoin chart analysis
On the chart of Bitcoin, we see how the greater volatility started on Friday with the drop below the $70,000 level. We broke the EMA200 moving average support, opening the bearish door. This led to the formation of the first low at the $65230 level. On Saturday, we saw an attempt to recover the price to $68,000.
There, we encounter a new open, and in the afternoon hours, with two strong bearish impulses, we fall down to the $61308 level. The reason for this retreat is the escalation in the Middle East and the sell-off of all cryptocurrencies. After falling to a new low, the price of Bitcoin managed to consolidate and start a weekly recovery. We returned above $64000 by the end of Sunday, closing the day at the $65750 level.

Do we have a consolidation for a return above the $70000 level?
On Monday, the price was in a slight retreat for the first few hours to the $64,790 level. We get new support there, and with two impulses, we climb to the $66640 level. With that, we are going to a new weekly high and expect a continuation to the bullish side. We have support in the EMA50 moving average at the $65500 level and expect to continue above $67000. Potential higher targets are $67500 and $68000 levels.
In the zone around $67650, we come across the EMA200, which could again pose a problem for the continuation to the bullish side. We need a negative consolidation and pullback down to the $64000 level for a bearish option. This brings us back to the Sunday support zone. By pulling below that support, we move to a new low, which shows the weakness of the price of Bitcoin and pushes it to a new low. Potential lower targets are $63000 and $62000 levels.


