The Euro index remains stable, while the yen looks down
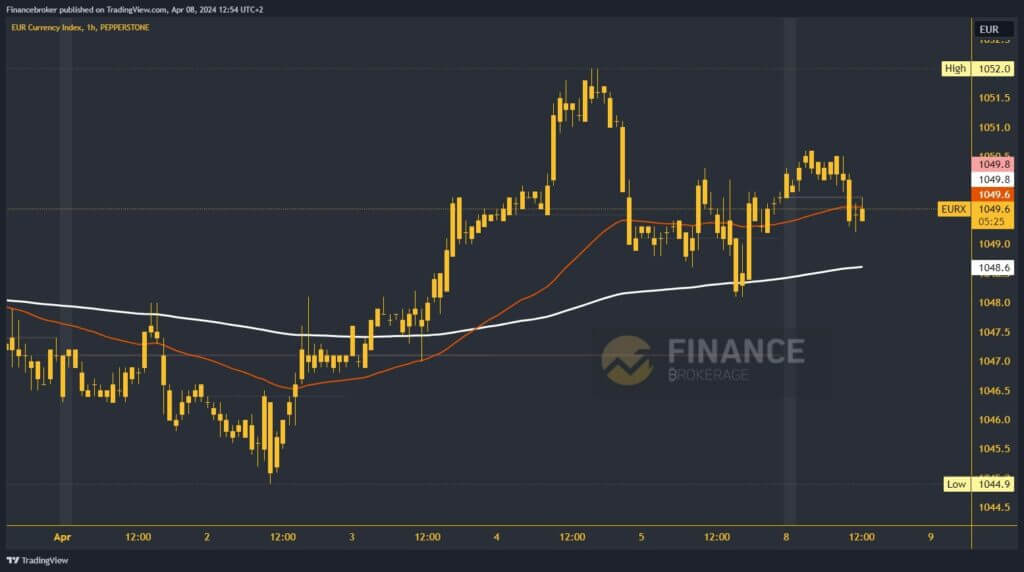
- Last week, we saw the Euro index at a new high at the 1052.0 level.
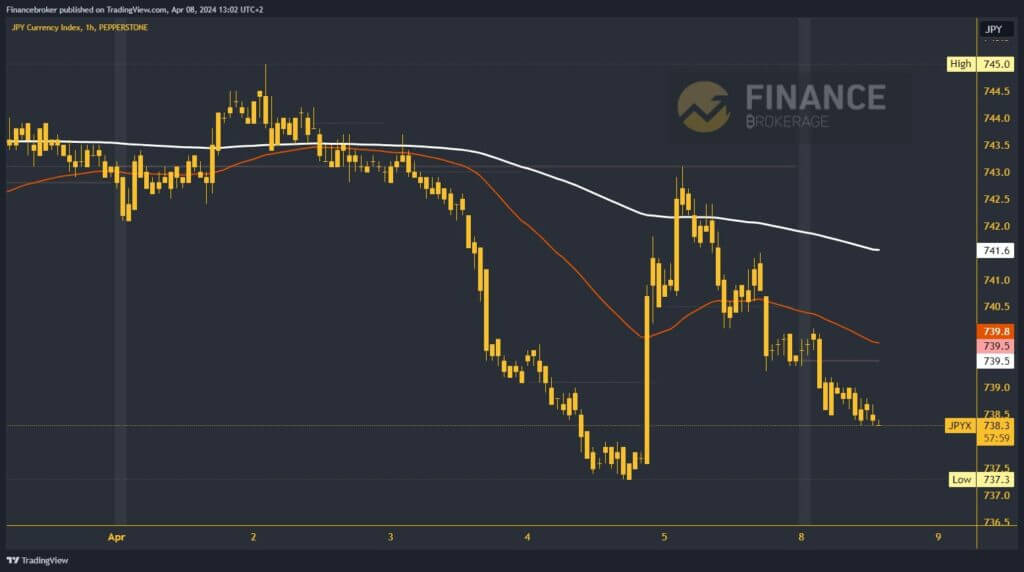
- Last week, the yen index was under heavy bearish pressure, which pushed it to a weekly low of 737.3.
Euro index chart analysis
Last week, we saw the Euro index at a new high at the 1052.0 level. After which the euro did not respond to the pressure in that zone and began to retreat. On Friday, the index fell to 1048.0, meeting the EMA200 moving average, stopping the decline and not allowing us to move below. With the new support, we started a new bullish consolidation, and this morning, we returned above the 1050.0 level.
After forming a high at the 1050.5 level, the euro index retreats again, this time to 1049.2. We have slipped below the weekly open price and are under pressure to move lower to the EMA200 moving average at the 1048.6 level. Since we failed to climb to a new higher high, we can say that a drop to a new lower low will follow compared to Friday’s. Potential lower targets are 1048.0 and 1047.5 levels.

Yen index chart analysis
Last week, the yen index was under heavy bearish pressure, which pushed it to a weekly low of 737.3. From that level, a strong bullish impulse followed to 743.0, where we encountered the EMA200 moving average. The index failed to hold above it, and a bearish consolidation was initiated that continues today. We are now at 738.4 and on a bearish path towards last week’s low. Potential lower targets are 737.5 and 737.0 levels.
We need a return above the weekly open price at 739.5 for the bullish option, the yen index. Then, we need to hold above and form a new bottom there. After that, we can hope for a continuation of the bullish consolidation and rise to higher levels. Potential higher targets are 740.0 and 740.5 levels. EMA200 moving average is up around the 741.5 level.


