


The dollar index remains below 106.00 on Monday
- Last week, we saw the recovery of the dollar index from 104.80 to 106.00 level.
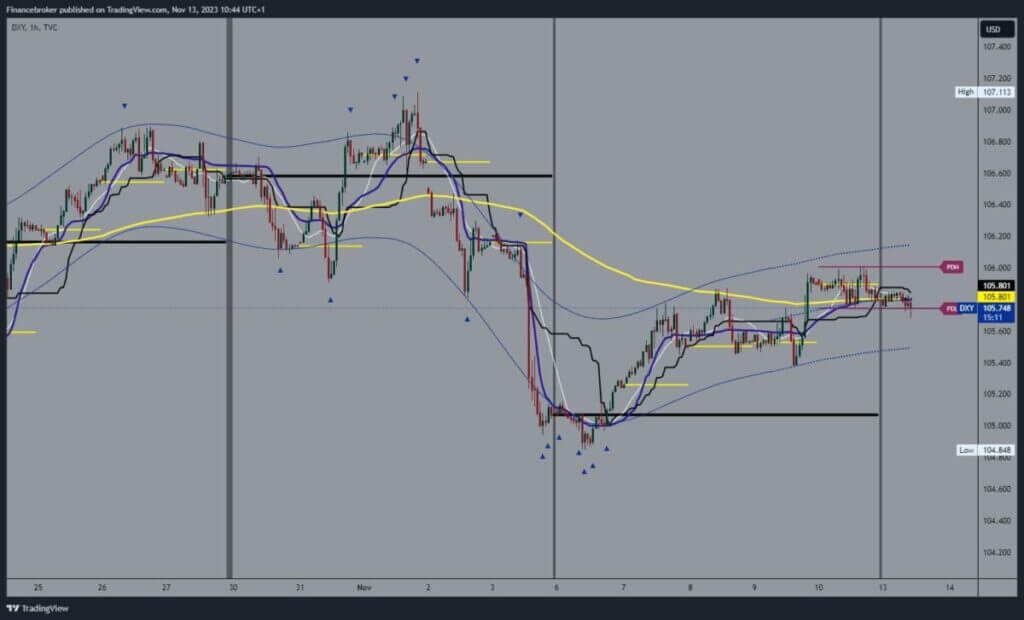
Dollar index chart analysis
Last week, we saw the recovery of the dollar index from 104.80 to 106.00 level. We encounter resistance at 106.00 level, and Friday is closed at 105.80. During the Asian session, we moved in the zone around that level, testing it and the EMA50 moving average. We now see bearish momentum and a breakout below this support.
Today’s current hunt was formed at the 105.69 level. The current picture tells us that we could see a further pullback as the dollar is under some pressure at the start of this week. This could affect further decline; the potential lower targets are 105.60 and 105.40.
We remain under pressure below the 106.00 level.
We need a positive consolidation and a return above the 105.80 level for a bullish option. That way, we would get back above the EMA50 moving average, which would immediately improve the dollar’s picture on the chart. With the support of the EMA50, we would start a further recovery and again attack the resistance at the 106.00 level.
A break above would be the real thing, reinforcing a bullish option for the dollar to continue its recovery. Potential higher targets are 106.20 and 106.40 levels.
This week, there will be a lot of important economic news from all trading sessions. The most important are the British CPI, the Eurozone CPI, and the US CPI. In addition, we should pay attention to Japan’s GDP for the third quarter, China’s industrial production, the Philadelphia Fed Manufacturing Index and Australia’s Unemployment Rate.

