The dollar index managed to recover from a volatile week
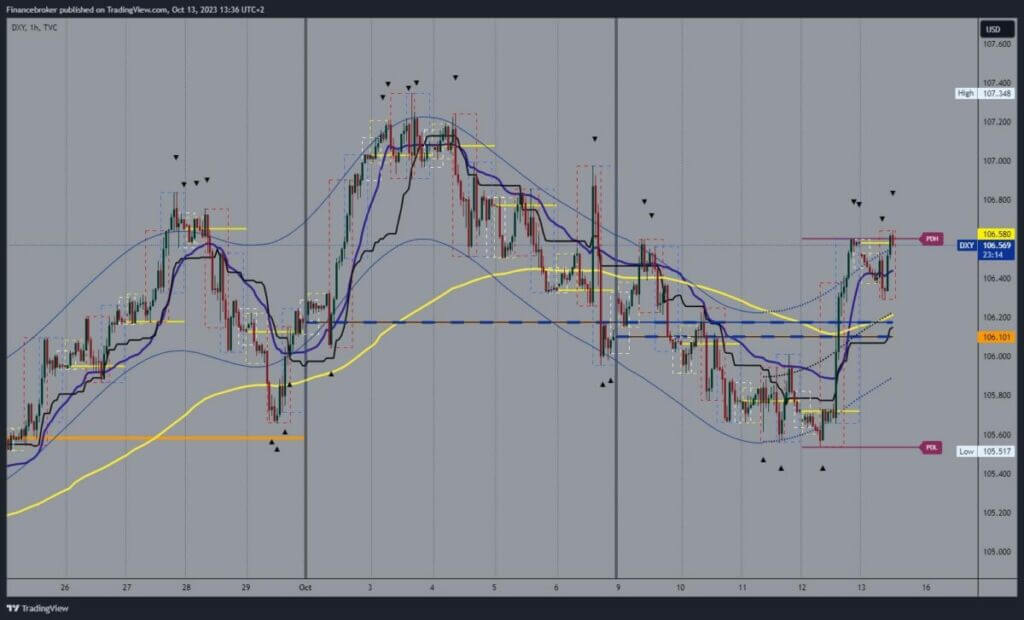
- For most of this week, the dollar index was in a pullback from 106.60 to 105.35.
Dollar Index Chart Analysis
For most of this week, the dollar index was in a pullback from 106.60 to 105.35. Yesterday, we managed to stop the fall and form a bottom at the 105.53 level. Positive economic news influenced the dollar to gain support and initiate a bullish impulse above the 106.00 level, forming a high at the 106.60 level.
During the previous Asian trading session, the dollar retreated to support at the 106.30 level. There, it gets new support and forms a higher low, from which we start the continuation of the bullish option. Additional support for the bullish option is the EMA50 moving average in the zone around 106.20 levels.
We are now waiting for a break above 106.60 to continue further recovery to the bullish side. Potential higher targets are 106.80 and 107.00 levels.

We need a negative consolidation and pullback
We need a negative consolidation and pullback to the 106.20 support level for a bearish option. A fall below this level and the EMA50 moving average would increase the bearish pressure on the dollar index to continue its retreat to lower levels. Potential lower targets are 106.00 and 105.80 levels.
Next week’s economic news will again dominate US market time: Retail Sales, Building Permits, Crude Oil Inventories, Initial Jobless Claims, Philadelphia Fed Manufacturing Index, Existing Home Sales, and Fed Chair Powell Speaks on Friday. We will single out from other markets: Chinese GDP, EUR CPI and GBP CPI.


