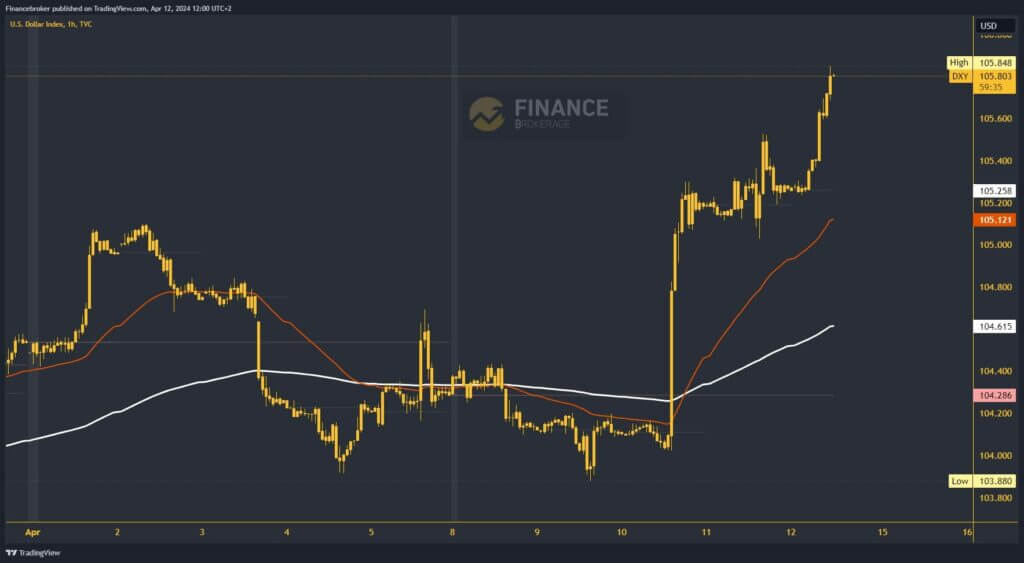
The dollar index approached the level of 106.00 on Friday
- The beginning of this week was not very promising for the dollar index.
Dollar index chart analysis
The beginning of this week was not very promising for the dollar index. The index retreated on Monday and Tuesday and fell to 103.88. That all lasted until Wednesday when data on US inflation was published. The data were positive and showed that there was a slight increase in inflation compared to the previous month.
Such a move is characterized as positive for the dollar because it postpones the interest rate cut by the FED at the next meeting. By the end of Wednesday, the dollar rose to 105.25 levels. We spent Thursday in consolidation with slight bullish indications up to the 105.50 level, and we closed the day at the 105.25 level.

Dollar before the threshold of 106.00, did you have the strength to jump over it?
During the Asian trading session, the dollar was successfully maintained in that zone, and with the start of the EU session, it started a new bullish consolidation and climbed to a new annual high at the 105.85 level.
We are currently in that zone, and it could easily happen that we go up and test the 106.00 level. Potential higher targets are 106.10 and 106.20 levels.
Today’s Asian and EU news favoured the dollar. First, we had the UK GDP, which was in line with forecasts at 0.1%. Then, data on German inflation was published, which was at the same level as earlier, at 0.4%. Such data was considered expected and not good enough to encourage the euro to grow.
The opposite happened, and the dollar seized the opportunity. Next week, we will have a smaller volume of economic news, and the most important are US Retail Sales, Chinese GDP, British CPI and Eurozone CPI.


