What is a symmetrical pattern?
Traders generally use three types of triangles in technical analysis: ascending, descending, and symmetrical. Symmetrical triangles, or symmetrical patterns, are valuable trading tools that allow you to set up an effective and profitable strategy. These triangles are especially essential to make more reliable forecasts of asset prices.
Symmetrical pattern: continuation pattern
A triangle is a chart pattern in which buyers and sellers clash, generally considered a continuation pattern. This means that when prices break out of the pattern, they are heading in the direction of the main trend that prevailed before the appearance of the pattern.
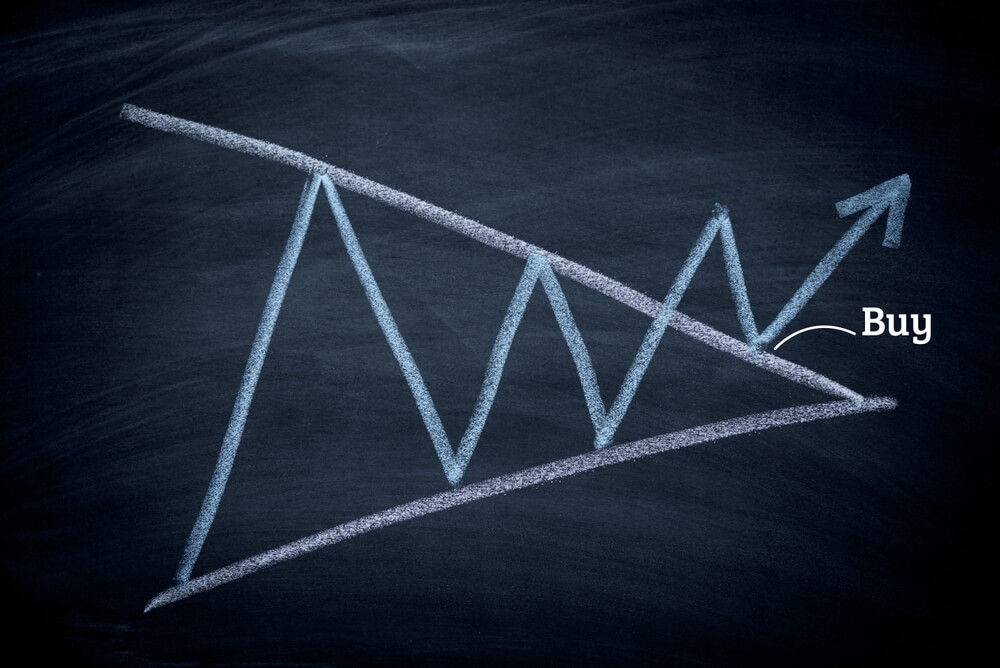
The symmetrical pattern, one of the three types of the triangle, along with the ascending triangle and the descending triangle, is composed of two converging lines surrounding the prices that form lower and lower highs and higher and higher troughs.
The first line represents a bearish slant connecting highs and forms a resistance line, while the second represents a bullish slant connecting troughs to form a support line.
Symmetrical pattern explained
Before determining the scenarios that allow the correct use of the symmetrical pattern, we must know more about its formation.
A symmetrical pattern is a figure that informs you about the neutrality and hesitation of investors in the market. There is an accumulation and a tightening of the asset until a violent breakout of the chart pattern when the market has decided on a bullish or bearish movement.
Symmetrical triangles are among the tools that can be observed on a chart and have their own particularities.
The symmetrical triangle is a pattern visible on a chart that appears when the market is undecided, and no player controls the prices. It is formed when two lines connecting the highest values and the lowest values appear on the graph.
For a symmetrical triangle to be validated as it is, one must observe at least two peaks at the lowest points and two others at the highest points of each line.
Also, a symmetrical triangle should produce a similar trend on the chart for three months or more.
Indeed, a symmetrical triangle that appears after three weeks is considered a pennant and cannot be used for advanced technical analysis. Moreover, the base of the second line should be higher than that of the first to confirm the existence of this triangle.
The vertex symmetric triangle
The symmetric apex triangle appeared when the move before the latent period was bullish. This triangle is, therefore, a continuation pattern, and it does not have the same name when it is visible after a bearish movement.
This particular figure also appears between two trend lines. We speak of a triangle with a symmetrical vertex when we can draw an oscillation between the two straight lines. When one of the lines is touched at least twice by the oscillatory movement, the symmetrical apex triangle is visible and can be used for technical price analysis.
Trading Symmetrical Pattern
As mentioned above, the symmetrical patterns inform us about the market’s hesitation to choose a bullish or bearish direction.
The most common is to identify this figure before the publication of an economic announcement. It is, therefore, necessary to be very careful when one of the two obliques is broken. Indeed, if there is no trading volume, there is a false signal, and the price will continue in neutrality until there is finally a buying or selling force. Adding a volume indicator in addition to the RSI or MACD can be a great technical indicator.
You must have a breakout of a slant with an impulsive candle to have a bullish or bearish flow; otherwise, it is a buy or sell trap. In short, it is essential to have several confirmations with this type of triangle. The best advice is to wait to see how the market evolves before taking a position with this type of chart pattern because it is very tricky.
When technical analysis is done, chart patterns are identified, and trading triangles are one of them. On the other hand, it should not be based on a triangle or other graphic configuration alone to place a trade. It’s a little more complicated, and there are conditions to be met for the breakout of a chart pattern to be confirmed.
How to determine the price target of a symmetrical triangle?
To calculate a triangle’s price target, you can plot the height or range from the base of the triangle to its breakout point. The theoretical objective of the symmetrical triangle, therefore, corresponds to the test of the first peak or trough (distance between the high point and the initial low point), which made it possible to form the shape of the triangle, carried over to the exit of the triangle.
The second method you can use to take your profit is to draw a trendline parallel to the one opposite the breakout line that you plot at the level of the first contact point of the triangle in the direction of the breakout.
It is advisable to always use a stop-loss when trading to protect your capital. If you want to set up a protection order by trading a symmetrical triangle, several methods depend on your trading style. You can place it just below/above the breakout point, depending on the trend, or at the level of the opposite side of the triangle.
Importance of volumes
Volumes should follow a particular pattern when forming a symmetrical triangle to confirm this chart analysis pattern. For example, they tend to weaken during the formation of the triangle, during the consolidation of the courses, before accelerating at the breakout of the support, or the crossing of the resistance when the prices leave the figure to evolve in the direction of the initial trend.
You should therefore pay close attention to volumes, as they will help you confirm certain trading setups and price movements. You will be able to take advantage of trading signals with a better probability of success.
How to use the symmetrical triangle in Forex?

The appearance of a symmetrical triangle is a source of information for establishing an effective trading strategy. By learning to identify and interpret it, traders can make more short-term profits.
High lines and low lines of the symmetrical triangle
Each horizontal line of the symmetrical triangle can help predict the current price trend. The high line is usually a resistance line.
It indicates to what extent traders can continue to sell the currency in question. On the other hand, the low line of the symmetrical triangle is a support line.
It allows the trader to know if the demand is sufficient to prevent the price from falling. Generally, the price bounces off this support line instead of crossing it.
When traders identify symmetrical triangles early enough, they place their orders at the right time and predict price rises or falls more accurately.
Statistics indicate that for a symmetrical triangle of the top, for example, one obtains an upward continuation in 89% of the cases. However, the trader must wait for the confirmation of a breakout to place his orders, at the risk of positioning himself on a false breakout.
The limits of the use of the symmetrical triangle
16% of breakouts seen on a symmetrical triangle are false alerts that can mislead the trader. Moreover, the breakout may occur before the price has reached the Ÿ of the triangle.
When this eventuality arises, traders who take positions lose more pips than they gain. The symmetrical triangle is, therefore, not a 100% reliable figure.
Related tools for using the symmetrical triangle
Traders should always wait for confirmation of the breakout to position themselves instead of anticipating it. What’s more, the use of related tools limits the margin of error and the risk of loss.
It is, therefore, necessary to use a relative strength index (RSI) or a capital gains anticipation filter to confirm the break in the trend on a symmetrical triangle.
Symmetrical pattern – Bottom line

The symmetrical pattern, which is one of the three types of the triangle along with the ascending triangle and the descending triangle, is composed of two converging lines surrounding the prices that form lower and lower highs and higher and higher troughs.
The first line represents a bearish slant connecting highs and forms a resistance line, while the second represents a bullish slant connecting troughs to form a support line.
The symmetrical triangle is a pattern visible on a chart that appears when the market is undecided, and no player controls the prices. It is formed when two lines connecting the highest values and the lowest values appear on the graph.
For a symmetrical triangle to be validated as it is, one must observe at least two peaks at the lowest points and two others at the highest points of each line.
Also, a symmetrical triangle should produce a similar trend on the chart for three months or more.
Traders should always wait for confirmation of the breakout to position themselves instead of anticipating it. What’s more, the use of related tools limits the margin of error and the risk of loss.


