S&P 500 and Nasdaq retreat ahead of US inflation news
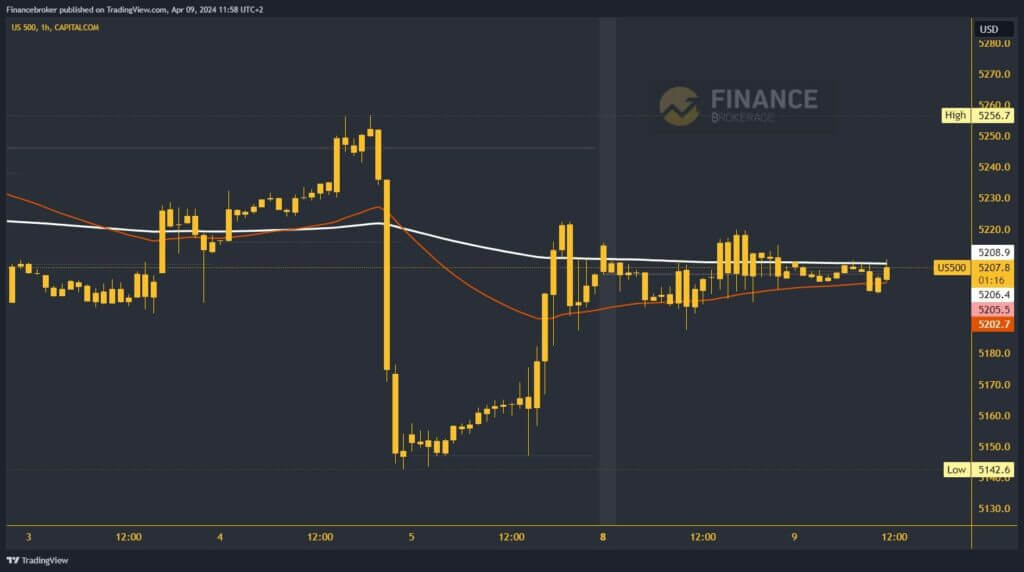
- On Thursday evening, the S&P 500 fell to 5142.6 levels, thus forming last week’s low.
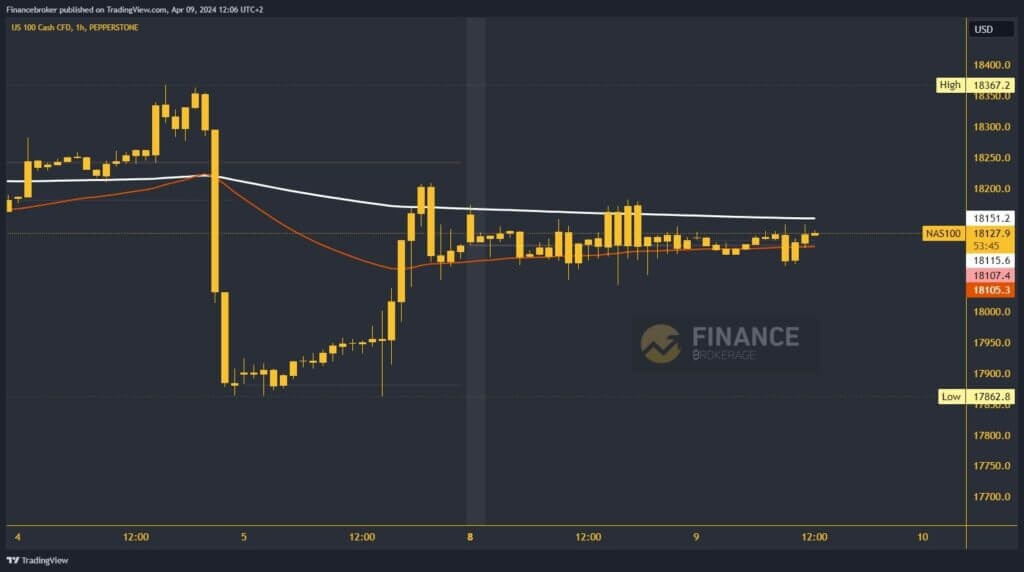
- The value of the Nasdaq fell to 17862.8 level on Thursday, a new weekly low.
S&P 500 chart analysis
On Thursday evening, the S&P 500 fell to 5142.6 levels, thus forming last week’s low. After that, we saw a recovery and growth up to the 5220.0 level on Friday. At the start of this week, the movement of the index is very limited in the 5195.0-5220.0 range. We expect the trend to continue until tomorrow’s US inflation news. This would increase the market’s volatility and, therefore, the movement of the S&P 500.
By moving above the 5230.0 level, we get rid of the bearish pressure and can continue to the bullish side without hindrance. Potential higher targets are 5240.0 and 5250.0 levels. By pulling back below the 5200.0 level, we will be under more bearish pressure to continue lower. At 5180.0, we form a new weekly low, thereby confirming bearish momentum. Potential lower targets are 5170.0 and 5160.0 levels.

Nasdaq chart analysis
The value of the Nasdaq fell to 17862.8 level on Thursday, a new weekly low. We recovered to the 18200.0 level on Friday and the EMA200 moving average. We failed to hold above, and the index retreated to 18050.0. Yesterday and today we are moving in the 18050.0-18150.0 range. We need a bounce to 18200.00 to get off the EMA200 pressure and return to the positive side.
Potential higher targets are 18225.0 and 18250.0 levels. We need a negative consolidation and pullback below the 18050.0 level for a bearish option. After that, we are again under pressure to move down to the 18000.00 level. It could easily happen that we break below that support and continue even lower. Potential lower targets are 17975.0 and 17950.0 levels.


