Solana is on his way to 60.00 and Cardano stopped at 0.390
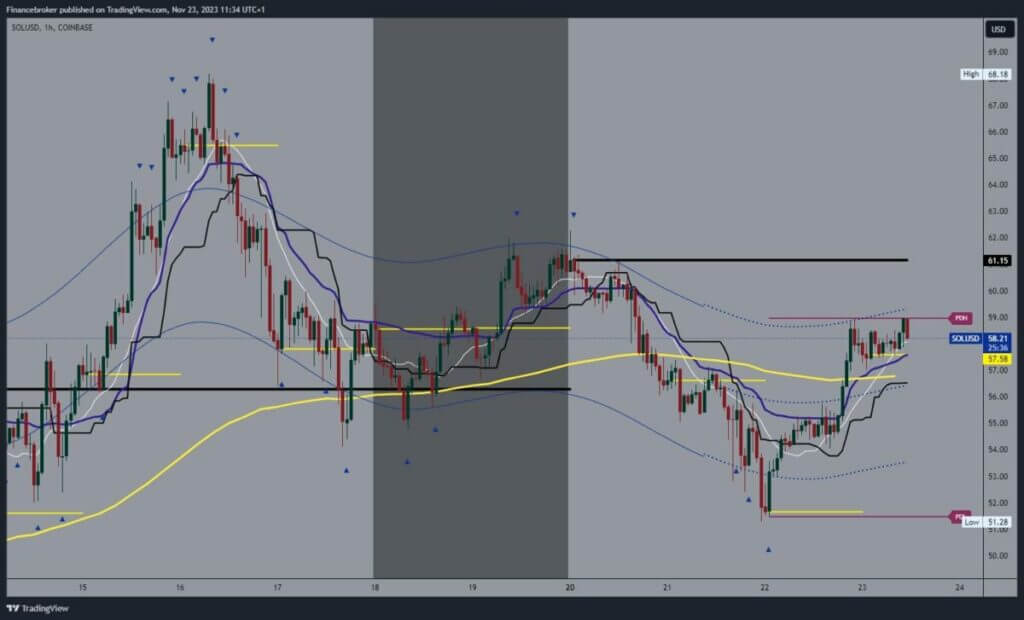
- After falling on Tuesday evening to the 51.28 level, the price of Solana started a rapid recovery to the 59.00 level on Wednesday.
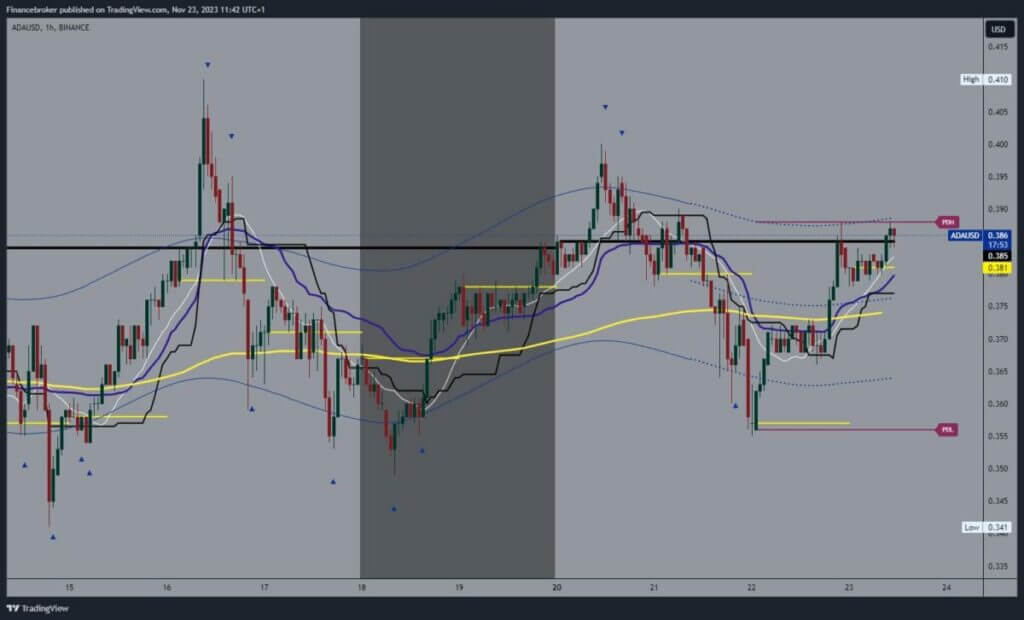
- Yesterday’s bullish consolidation led to the formation of a new two-day high price of Cardana at the 0.388 level.
Solana chart analysis
After falling on Tuesday evening to the 51.28 level, the price of Solana started a rapid recovery to the 59.00 level on Wednesday. For now, we have resistance in that zone and are moving sideways in the 57.00-59.00 range. We have good support and expect to see a break above and a move to the 60.00 level. Then, we would have to stay up there to form the bottom from which we would start to continue the recovery.
Potential higher targets are 61.00 and 62.00 levels. We need a negative consolidation for a bearish option, a drop below the 57.00 level and the EMA50 moving average. A break below these support levels would put the price under more pressure to initiate a deeper pullback. Potential lower targets are 56.00 and 55.00 support levels.

Cardano chart analysis
Yesterday’s bullish consolidation led to the formation of a new two-day high price of Cardana at the 0.388 level. We currently have resistance at that level and a slight pullback to 0.384. Today, we mostly moved in the zone around the 0.380 level and managed to stay above it. New pressure on that zone could influence us to see a breakout below and a drop to today’s new low. Potential lower targets are 0.375 and 0.370 levels.
We will have additional support for the price of Cardana in the zone around 0.375 in the EMA50 moving average. We need a positive consolidation and a jump above the 0.390 level for a bullish option. Thus, we would form a new high and get confirmation of bullish momentum. After moving above, it is also necessary to stay up there in order to wait for a new bullish impulse and start to continue on the bullish side. Potential higher targets are 0.395 and 0.400 levels.


