Solana and Cardano: Cardano retreated to the 0.525 level
- During the weekend, the price of Solana jumped above the 105.00 level.
- Cardano’s price is moving sideways in the 0.520-0.540 range this week.
Solana chart analysis
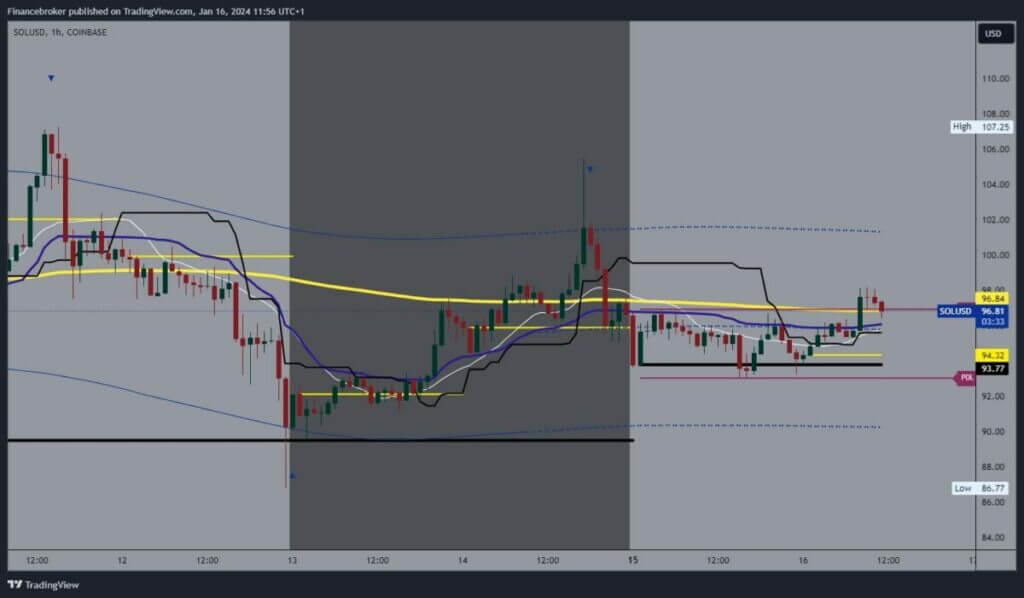
During the weekend, the price of Solana jumped above the 105.00 level. The rejoicing up there was short-lived as a bearish impulse followed and a drop to the 93.00 level last night. The retreat was stopped there, and Solana slowly recovered to 98.00 levels. We briefly moved back above the EMA200 moving average as saturation occurred, and the price pulled back to the 96.50 level.
We need another bounce above 98.00 to trigger us to the bullish side. Potential higher targets are 99.00 and 100.00 levels. We need a pullback to the previous support at the 93.00 level for a bearish option. New pressure in that zone could cause a drop below and the formation of a new weekly low. This would confirm the bearish momentum. Potential lower targets are 92.00 and 91.00 levels.

Cardano chart analysis
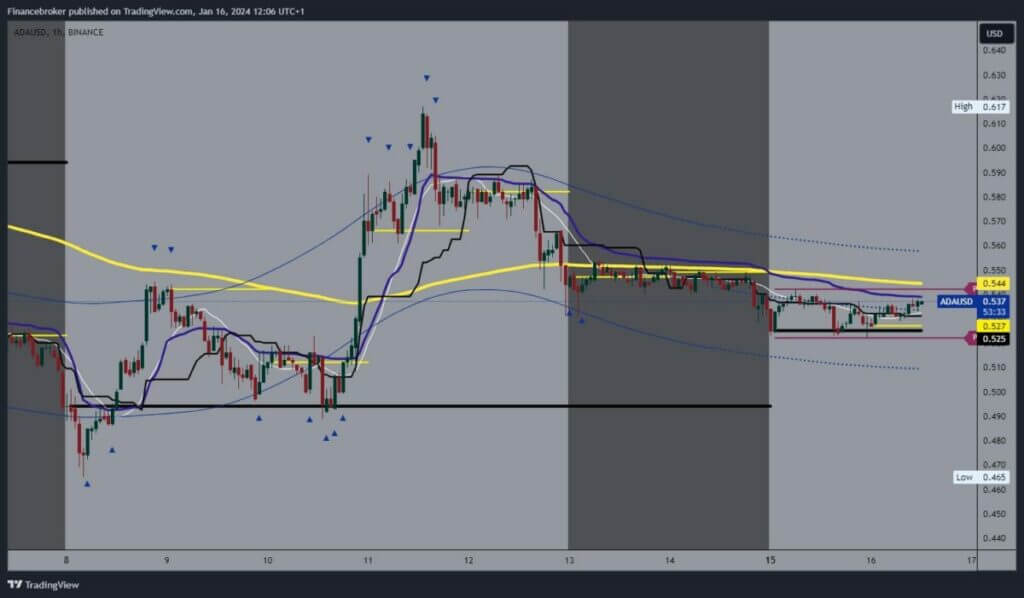
Cardano’s price is moving sideways in the 0.520-0.540 range this week. Today’s trend is bullish because we started from the support level this morning and are on our way to the upper line of this range. In the zone around the 0.545 level, we encounter the EMA200 moving average, which has been an obstacle to the bullish option for four days.
Today we have a new opportunity to try to break above and start a continuation to the bullish side. Potential higher targets are 0.550 and 0.560 levels. We need a negative consolidation and pullback to the previous support level for a bearish option. New pressure on that zone would influence us to see a drop below and the formation of a new low. Thus, we would return to last week’s support zone, and potential lower targets are 0.510 and 0.500 levels.


