SafeMoon and Litecoin: SafeMoon remains below 0.00006000
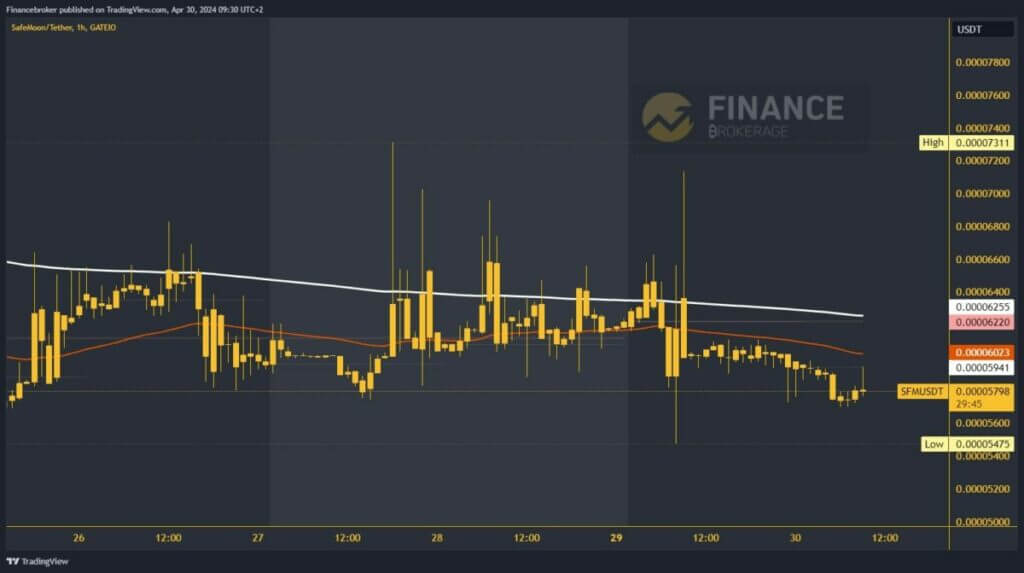
- The price of SafeMoon is in a sideways trend for the second week, moving in the 0.00005475-0.00007000 range.
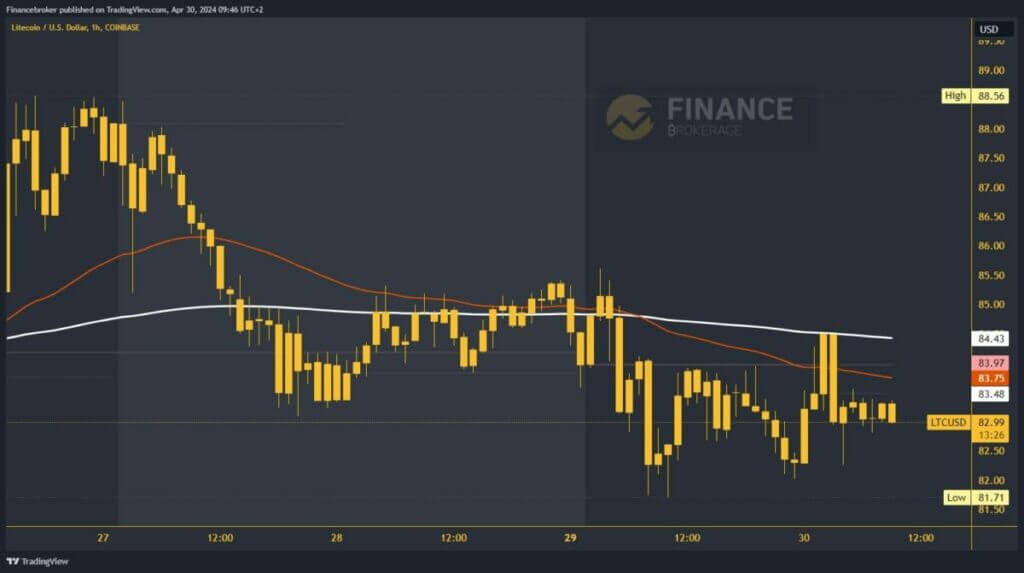
- Litecoin climbed to $88.56 on Friday, forming a new weekly high there.
SafeMoon chart analysis
The price of SafeMoon is in a sideways trend for the second week, moving in the 0.00005475-0.00007000 range. Yesterday we had a slight increase in volatility on the chart.
First, there was an impulse down to 0.00005475, then in the next hour, up to 0.00007200 levels. It was all in a short breath, and we quickly returned to normal at the 0.00006000 level.
On the downside, we are still holding below the EMA200 and EMA50 moving averages, thus remaining under bearish pressure. Potential lower targets are the 0.00005600 and 0.00005400 levels.
We need to climb above 0.00006400 and the moving averages for a bullish option. With their support, it will be much easier for us to move on to the bullish side. Potential higher targets are 0.00006600 and 0.00006800 levels.

Litecoin chart analysis
Litecoin climbed to $88.56 on Friday, forming a new weekly high there. After that, bearish consolidation begins on Saturday and falls to $83.25. We were able to consolidate there and recover and move back above $85.00 and the EMA200 moving average. On Monday, the price falls again under bearish pressure, breaking through the weekend low and descending to a new level of $81.71.
At that level, we form a weekly low, and so far, we have managed to stay above it. This morning, we saw an attempt to recover to the $84.50. There, we meet the EMA200 again and bounce back down again. We are now in the zone of the $83.00 level, looking for new support. It could easily happen that we slip below and test yesterday’s low. Potential lower targets are $81.50 and $81.00 levels.


