Ripple Price Analysis: Tron Falls Below the 0.140000 Level
- During the weekend, the price of Ripple continued its previous bullish consolidation, reaching a new high at the 0.6510 level
- Tron’s price has been retracting since last week’s spike to the 0.144371 level
Ripple chart analysis
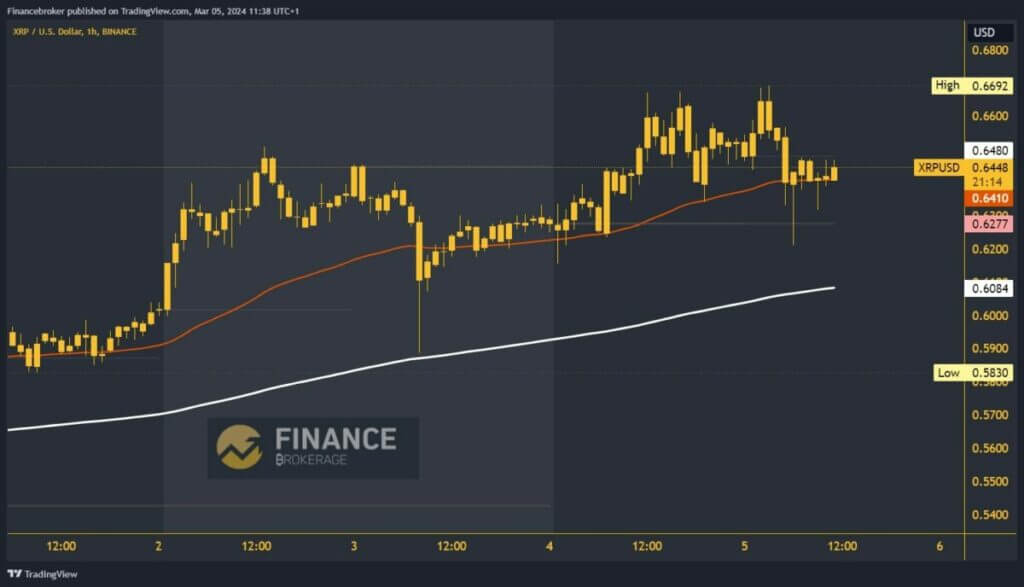
During the weekend, the price of Ripple continued its previous bullish consolidation, reaching a new high at the 0.6510 level. Following this, we observed a brief pullback to support at 0.5900, where we encountered the EMA200 moving average. With its support, we initiated bullish consolidation, and this morning, we formed a new high at the 0.6692 level. We paused there, and Ripple experienced a pullback to the 0.6200 level.
From this new support level, the price climbed to 0.6450, where we currently stand. We expect to see a continuation to the bullish side, with potential higher targets at the 0.6600 and 0.6700 levels. For the bearish scenario, we need a pullback of the price below the weekly open price of 0.6277. Below that level, we retest the daily low. With a new lower low, we affirm the bearish momentum and potential lower targets at the 0.6100 and 0.6000 levels.

Tron chart analysis
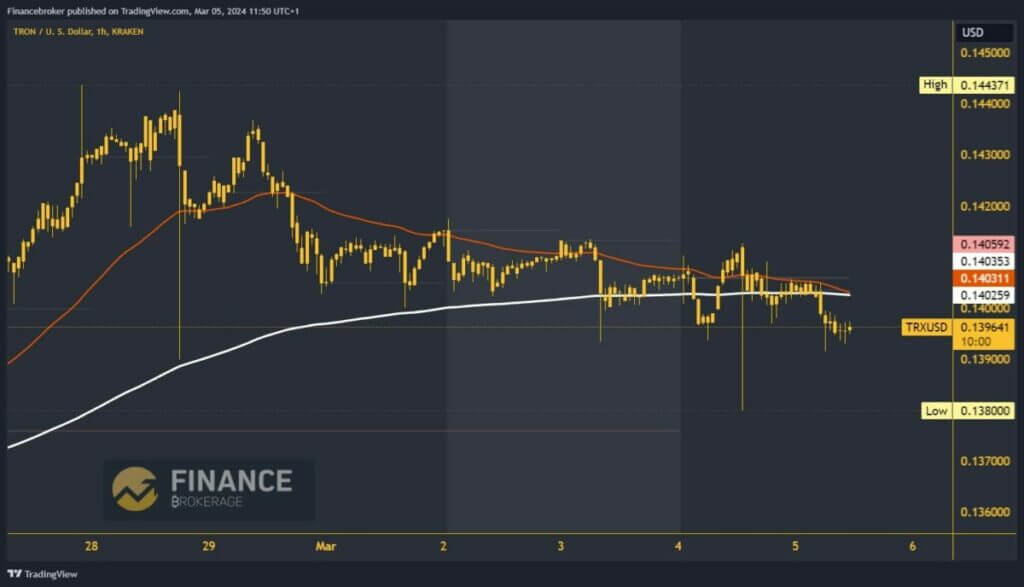
Tron’s price has been retracting since last week’s spike to the 0.144371 level. During the weekend, we saw a continuation of bearish consolidation and a drop below the 0.140000 level. In that zone, we encountered the EMA200, which attempted to provide support and halt the decline. Yesterday, we witnessed new pressure on the price and a stronger drop below the EMA200 moving average. At one point, the price dropped to the 0.138000 level but quickly recovered above the 0.140000 level.
This morning, we saw the price in a narrow range of movement between 0.140000 and 0.140300. We couldn’t hold, and a breakthrough below the lower level and the EMA200 moving average followed. A new daily low was formed at the 0.139000 level, leading to an increase in bearish pressure on Tron’s price. It could easily slip even lower. Potentially lower targets at the 0.138500 and 0.138000 levels.


