


What are order blocks in Forex?
During the past several years, the world of trading has drastically changed. Casual retail traders are increasingly present in financial markets online trading. If you are one of those eager to start an online trading adventure, you will certainly need to get to know the basics. One of the most basic concepts in the financial market is order blocks. In this article, we show you what order blocks are in Forex.
We will also briefly tackle other assets to give you a broader picture of this trading concept. So let’s take a look at what order blocks represent, how to trade order blocks in Forex, and much more.
What are order blocks in trading – trading blocks in Forex
So what are order blocks in Forex? Before we answer the question, let’s see its general meaning in trading. Trading in blocks refers to trading assets in large quantities, usually by big banks and institutions.
These blocks stand for the supply and demand zones in which these big players, institutional traders on the market, complete huge transactions. As these trading orders can disturb the market’s overall trends and entice significant volatility, central banks and financial institutions must create special orders. These are called order blocks.
At its core, trading in blocks involves splitting orders into several blocks to make purchases. It must be done a couple of times until the buying target of an asset is reached.
For instance, if a bank needs to buy 300 million EUR/USD, they will do it in several blocks of purchases. Big banks and financial institutions apply this strategy to avoid making big disturbances in the market while reaching their goals.

Blocks in Forex trading – example
So, as we explained, the trading blocs are the large quantities of assets traded by banks and big players on the market. As a trader on Forex, you need to spot these distribution or accumulation zones in technical charts.
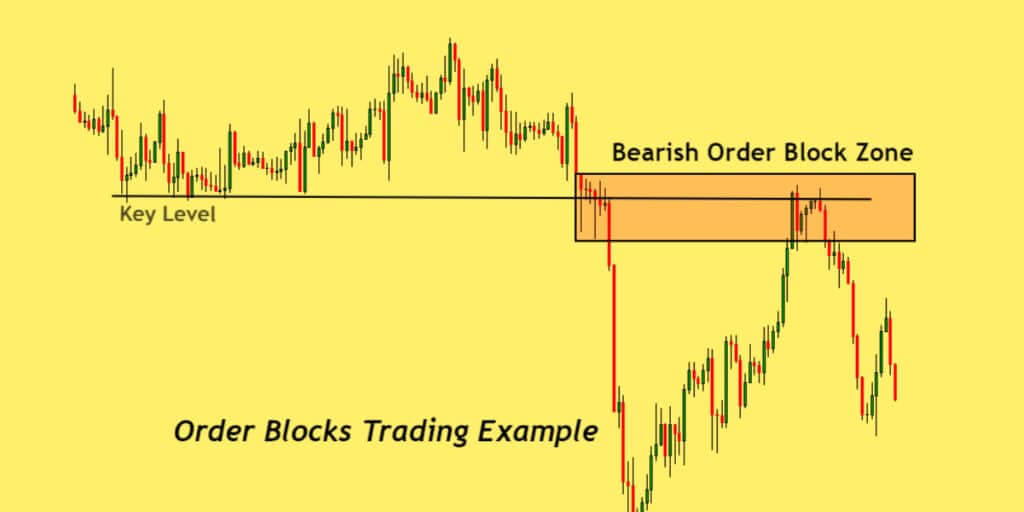
These represent bearish and bullish trends in the market. BuOB, bullish order block, means that a bank or some financial institution accumulates large quantities of specific currencies. For instance, suppose that the Japanese national bank aims to weaken its national currency against the dollar.
Therefore they will buy US dollars in large quantities, and in that way, they will entice economic growth in Japan.
When it comes to the graphic representation of this market situation, it’s as follows. We will see a long-range trend in the market for a longer period. Then you will see candlesticks, usually in green, showing huge trading volumes and a bullish market.
Things to pay attention to when using order blocks in your trading
Order block in trading helps traders find the right direction in the market. It also helps investors identify what institutions and banks aim to do. So there are several useful tips to help you use the order blocks trading strategy when trading currencies.
Identifying order blocks when trading in facial markets is not something you can use in your trading plan.
It’s uncertain when the banks and financial institutions will decide to enter the market. You are usually informed about this just after the order has happened.
Trades cannot rely at all on trading block orders as a part of their strategy. But they can learn to use them properly whenever order blocks occur in the market.
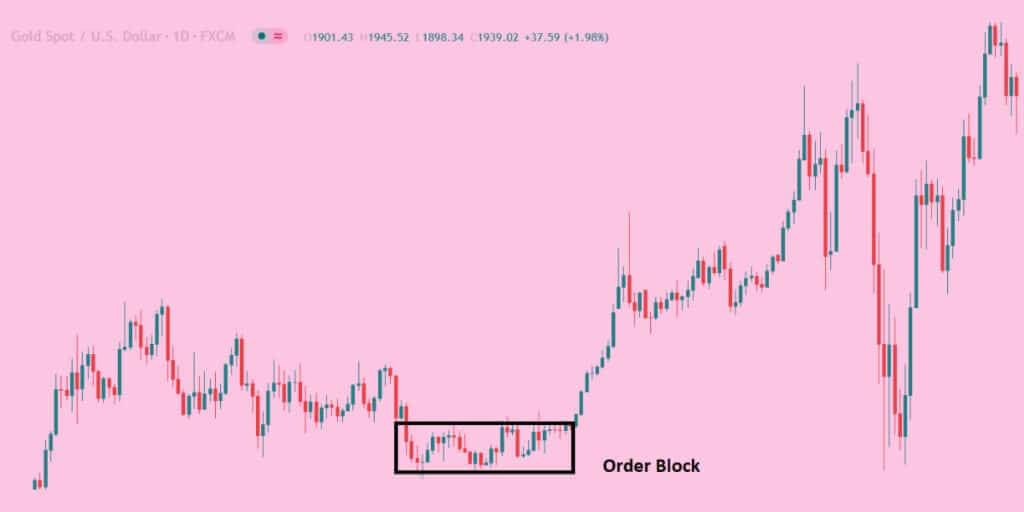
During the accumulation/distribution period, markets show a tendency to trade sideways. Also, they move in a specific direction when the pile-up has been completed.
Once that happens, one rule of thumb should be applied. In ranging markets, the longer the range period, the more significant the market trend. It is important to consult the Wyckoff analysis pattern to determine the henry points when the price goes above or below support and resistance levels.
In most cases, institutions and banks want to extend the time frame so they can continue their purchase and reach the purchase targets at the same price levels without the need to deal with trending markets.
Finally, volume indicators are indispensable if you want to trade blocs in Forex. You should combine several volume indicators.
The accumulation period in the market is when high volumes of an asset are being traded. It means that some big players on the market buy large quantities of a specific currency in Forex. As stated before, the blocks in trading may seem like trend ranges, but they are not. To ensure that the range is order block, you should use volume indicators to validate that there are uncommon trading volumes traded.

Order block in Forex – the importance of Accumulation/Distribution indicator
The Accumulation/Distribution indicator, created by Larry Williams, is an indicator that relates prices and volumes.
The purpose of this analysis tool is to assess the intensity of the market. This indicator makes it possible to identify the phases of accumulation of orders and distribution.
An uptrend of the indicator corresponds to an accumulation phase where the security is bought, with higher highs and higher lows.
A downtrend in the indicator corresponds to a distribution phase where the security is sold, with lower highs and lower lows.
This indicator is effective for following and, above all, confirming a trend.
Calculation method
Flight. Accumulation = [ ((C – PB) – (PH – C)) / (PH – PB) ] * V
C = The closing price of the day
PB = The lowest price reached
PH = The highest price reached
V = Daily Volumes
An increase in the indicator indicates an accumulation (buying) phase where prices close near session highs.
A decrease in the indicator indicates a distributing (selling) phase where prices close near session lows.
The evolution of the indicator will be all the more impacted by a session as the volumes are strong.
One technique for using this indicator is to spot trend reversals in the indicator:
Uptrend: A change from a distribution phase to an accumulation phase reveals that the security is no longer distributed.
Downtrend: A move from an accumulation phase to a distribution phase reveals that the security is no longer accumulated.
The trend is considered strong when the indicator and prices move in a correlated fashion.
The trader can also spot divergences with this indicator. Divergence reveals that volumes are larger on the opposite move than price.
A bearish divergence reveals that the lows are supported by larger volumes than the highs while the price rises.
A bullish divergence reveals that the highs are supported by greater volume than the lows while the price is falling.
What is a volume in forex trading, and how to trade volumes?

Volume in the currency market is the quantity of lots traded or sold during a given period.
Volume is also related to the liquidity of a market, i.e., When the number of traders is high in the market, you are more likely to enter and exit positions quickly and with a lower spread. The major currency pairs have the biggest trading volumes and benefit from the greatest liquidity.
Pair with low volumes mean less liquid as fewer traders buy and sell the currency. It’s mostly the case with exotic and minor currency pairs.
Daily forex trading volume amounts to $6.6 trillion, as per the 2019 Central Banks Triennial Survey of Foreign Exchange and OTC Derivatives Markets. The euro, yen, and US dollar have the highest trade turnover.
Currency pairs experience the greatest daily trading volume and greatest liquidity when the sessions overlap. In case those trades are open simultaneously. For instance, the GBP/USD pair will experience higher volumes when the New York and London trading sessions are active.
You will also see significant volume for currency pairs following important economic info releases and news events. Any indication of a change in a country’s economic condition will prompt traders on Forex market to open and close positions, enticing an influx of activity in the market.
Calculation of volumes in Forex
It could be a complex process since there is no single source of currency market transaction data. Once you spot volumes featured on analysis charts, they are usually just trading for the broker or stock market you are using instead of global trading volumes.
In the stock market, volume is a little simpler because there are central order books where trades are recorded.
However, this means that we have a lagging volume indicator since it takes some time for the collection of data. For instance, exchanges typically record volumes every five minutes.
How to use volumes in currency trading?
You use volume in the currency market to have a clear picture of what other individual traders or financial institutions are doing. The volume is a crucial indicator of currency pairs accumulation.
Look at it this way: market trends can only continue if new traders join the market and give it momentum. Volume cannot show which way the market takes. But volumes can give an indication as to how strong or weak a trend is.

