Oil and natural gas: The price of oil is back at $82.00
- The price of oil continues with a bullish trend despite a little volatility on Wednesday.
- For the third day in a row, the price of natural gas is in a bullish trend after falling to the $2.46 level.
Oil chart analysis
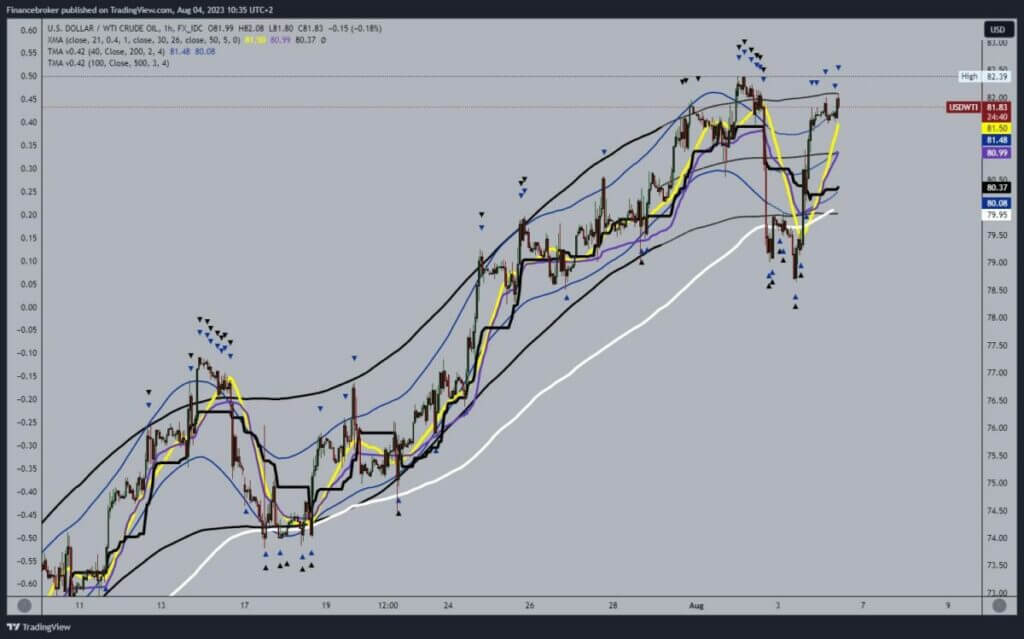
The price of oil continues with a bullish trend despite a little volatility on Wednesday. On Wednesday, the price fell from $82.40 to the $78.60. Yesterday, we saw a strong bullish impulse at the beginning of the US session, and the price of oil returned above the $80.00 level. The price continues to rise for the rest of the day, and the day closes at the $81.70 level.
During the Asian trading session, oil managed to hold high, and now we see a test of the $82.00 level, and we could expect a break above. We need a positive consolidation and a break above the $82.00 level for a bullish option. Potential higher targets are $83.00 and $84.00 levels.
We need a negative consolidation and a price pullback below the $81.50 level for a bearish option. There we would fall below the Asian support, which would mean a potential further decline. Potential lower targets are $81.00 and $80.00 levels.

Natural gas chart analysis
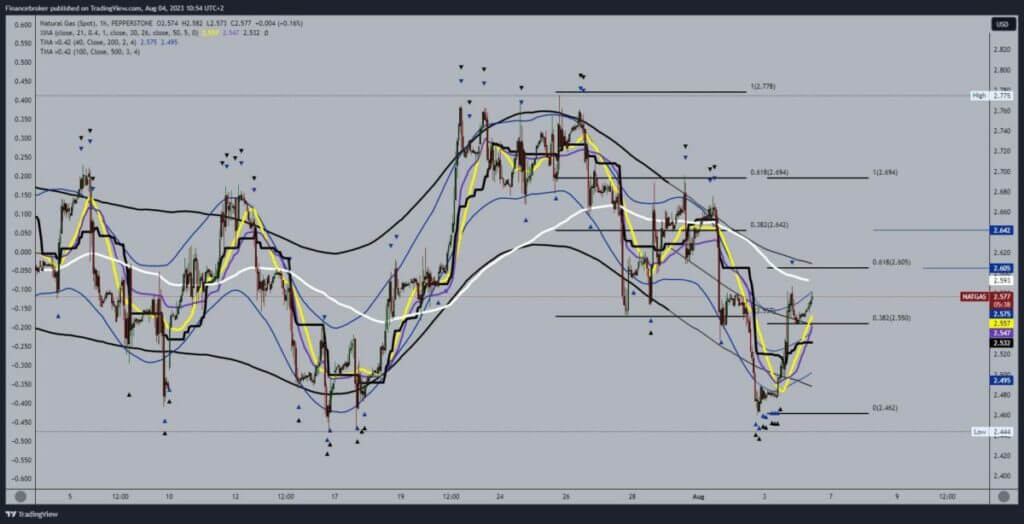
For the third day in a row, the price of natural gas is in a bullish trend after falling to the $2.46 level. Yesterday we saw a jump to the $5.87 level, then stabilization at the $2.55 level. During the Asian session, the price of natural gas continues to recover, and we are now very close to testing the previous high.
It is very possible that we will see a break above and continued growth towards the $2.60 level. Potential higher targets are $2.62 and $2.64 levels. We need a negative consolidation and a price pullback below the $2.55 support level for a bearish option. After that, we could expect the price to continue its retreat. Potential lower targets are $2.52 and $2.50 levels.


