Oil and Natural Gas: The price of oil falls to the $64.10
- At the beginning of this week, the price of oil continued with a bearish trend.
- The price of natural gas fell to $2.31 this morning.
Oil chart analysis
At the beginning of this week, the price of oil continued with a bearish trend. Today’s low was at the $64.10 level, and based on the current picture, a further drop in oil prices can be expected. We need a negative consolidation and a drop below the previous low to continue the bearish option. Potential lower targets are the $64.00 and $63.00 levels.
We need a new positive consolidation and price jump to the $67.00 level for a bullish option. We had a previous consolidation there, and we need a breakout above. Then it is necessary to maintain up there so that with the next bullish impulse, we can start the continuation of the recovery. Potential higher targets are the $68.00 and $69.00 levels.

Natural gas chart analysis
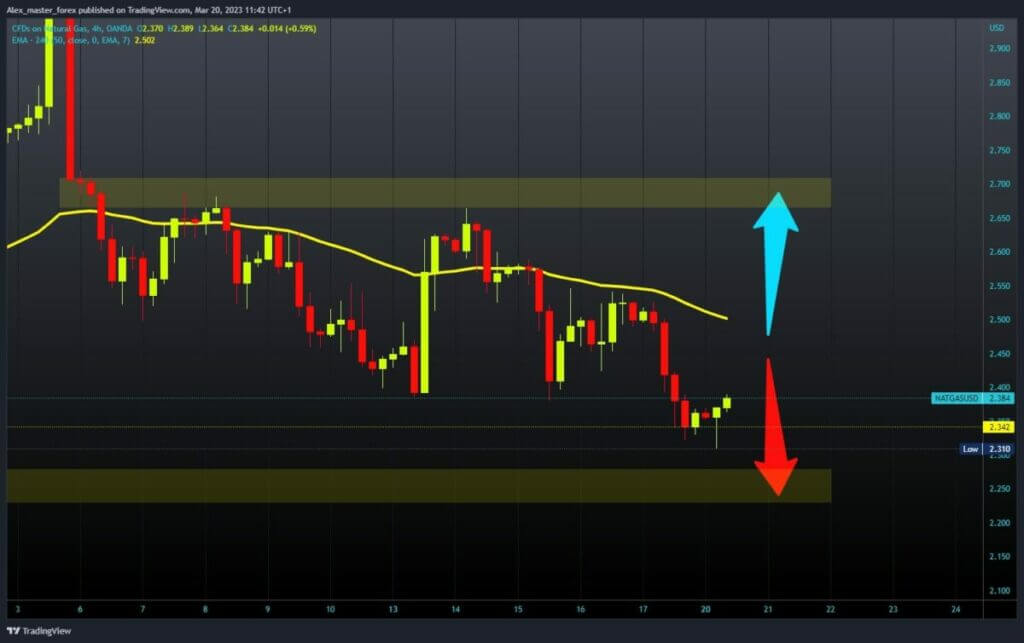
The price of natural gas fell to $2.31 this morning. On Friday, the gas price failed to maintain at $2.50, and a pullback to this morning’s low followed. Since then, we have seen a slowdown in the bearish trend, and the price has managed to consolidate and start a positive consolidation. To begin with, we need a return above the $2.40 level.
After that, we need to hold above and start a new price recovery with a new impulse. Potential higher targets are the $2.50 and $2.60 levels. We need a negative consolidation and a retest of this morning’s support for a bearish option. A break below would mean that the bearish trend continues. Potential lower targets are the $2.25 and $2.20 levels.


