Oil and natural gas: Oil prices continue to recover
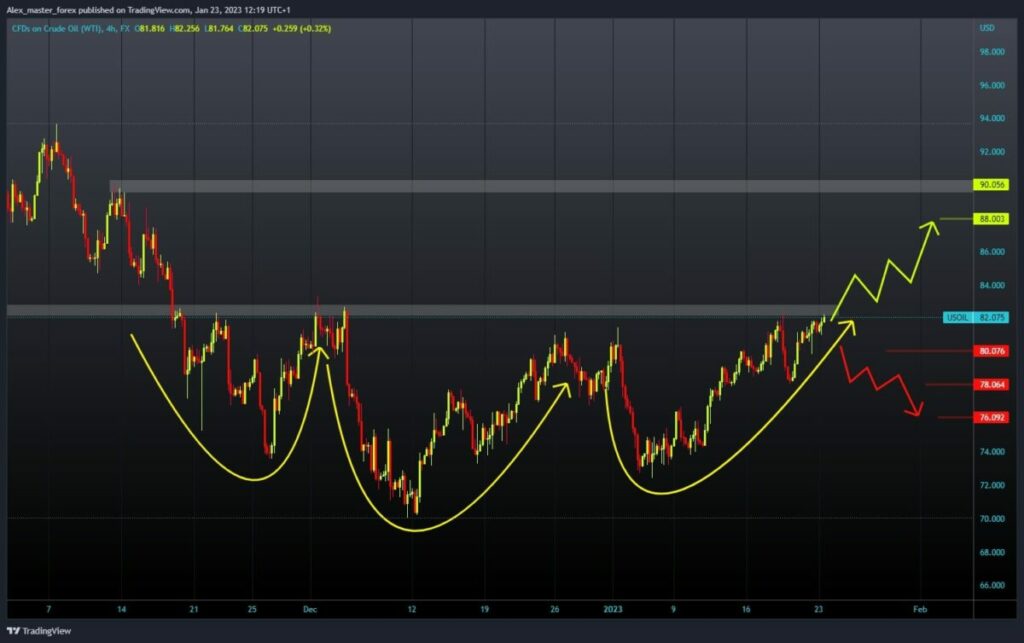
- If we look at the broader picture from the end of the previous year until now, we see that oil price has formed a triple bottom.
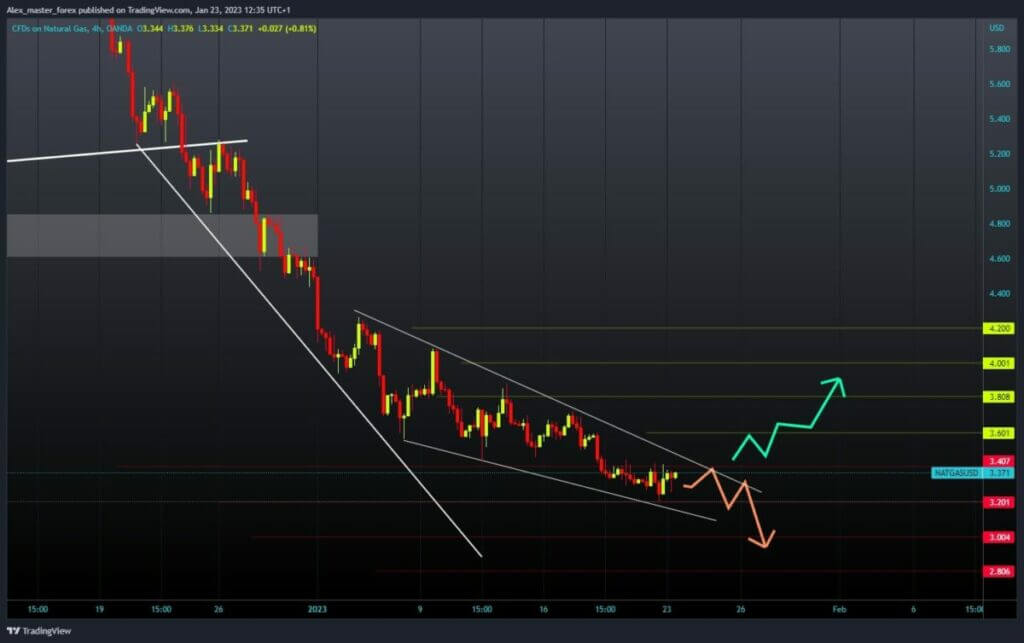
- The price of natural gas fell to a one-and-a-half-year low of $3.20 on Friday.
Oil chart analysis
If we look at the broader picture from the end of the previous year until now, we see that oil price has formed a triple bottom. The last bullish consolidation brought us to the $82.00-$83.00 resistance zone. We need a break above if we want to see further oil price growth. The potential next important zone is $84.50-$85.00, and if we manage to break above it, the oil price could go up to $88.00 and even up to $90.00.
For a bearish option, we need a new negative consolidation that would lead to a pullback in price, and a price drop on the support level at $80.00. The inability to hold there will lead to a further drop in the price below this level. Potential lower targets for us could be $78.00 and then $76.00.

Natural gas chart analysis
The price of natural gas fell to a one-and-a-half-year low of $3.20 on Friday. The last time we were at that place was in June 2021. During the Asian trading session, the gas price formed a bottom at that point and began slightly recovering to $3.37, the current level. We need a positive consolidation and a break above the $3.40 level for a bullish option.
Then it is necessary to maintain up there so that with a new bullish impulse, we can start the continuation of the resistance of the price. Potential higher targets are the $3.60 and $3.80 levels. For a bearish option, we need a negative consolidation and a new test of support at the $3.20 level. A break below would increase bearish pressure, which could see the price decline and test the $3.00 support level.


