Oil and Natural gas: Oil is holding above the $73.00 level
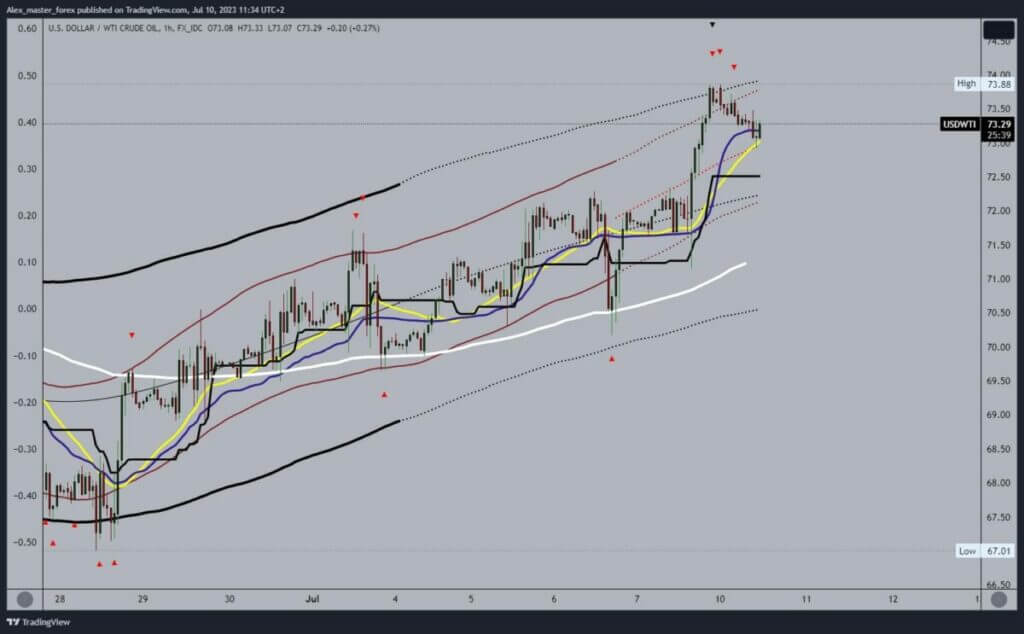
- On Friday, the oil price rose to a one-month high of $73.88.
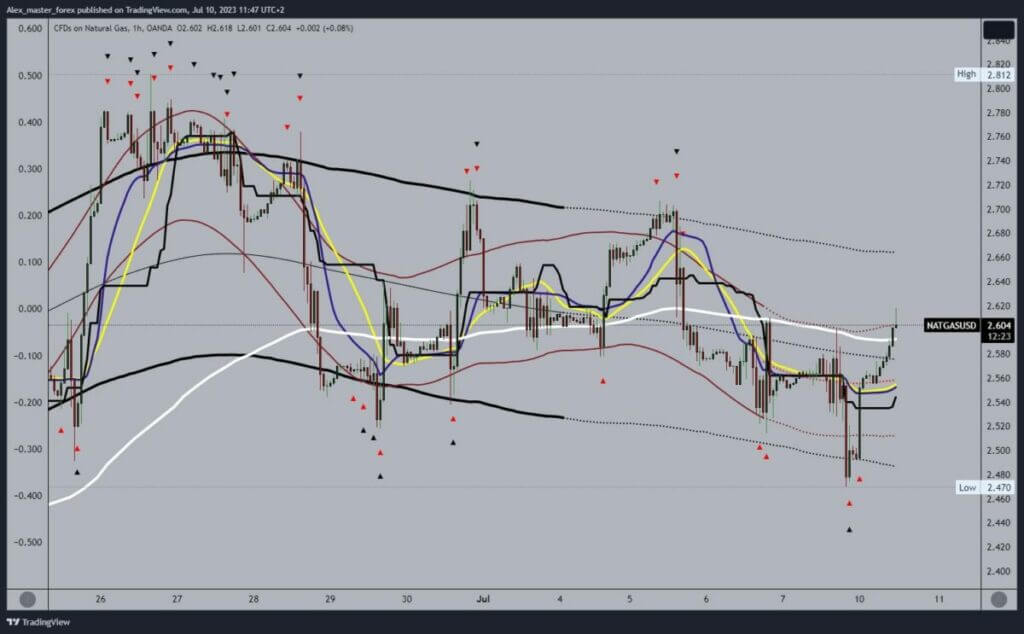
- On Friday, we saw a pullback in the price of natural gas to the $2.47 level.
Oil chart analysis
On Friday, the oil price rose to a one-month high of $73.88. After that, the price starts to pull back, which has continued today. Today’s low oil price is $72.95, and we manage to stay above it for now. The price has bounced back above the $73.00 level and could trigger a bullish option. Potential higher targets are the $74.00 and $75.00 levels.
We need a negative consolidation and a new decline below the $73.00 level for a bearish option. After that, we could expect to see a drop to the $72.50 support level. A price break below would indicate a further weakening of the oil price. Potential lower targets are $72.00, $71.50 and $71.00 levels. Additional price support at the $71.00 level could be provided by the EMA50 moving average.

Natural gas chart analysis
On Friday, we saw a pullback in the price of natural gas to the $2.47 level. From that moment, the price consolidated at that level and began to recover. During the Asian session, we returned above the $2.50 level, and the price continued its recovery. The price rises above the $2.60 level in the EU session and crosses above the EMA50 moving average.
Now we have his support, and we can start further recovery. Potential higher targets are the $2.64 and $2.66 levels. At the $2.70 level, we would be able to test the previous high prices. We need a negative consolidation and pullback below the EMA50 and the $2.58 level for a bearish option. This could negatively affect the price and send it to lower support levels. Potential lower targets are the $2.56 and $2.54 levels.


