Marubozu Candle in Technical Analysis: Explained
Key takeaways:
- The Marubozu candle is a significant candlestick pattern in technical analysis, characterized by its absence of shadows and representing a specific price configuration.
- It indicates market sentiment, price action, and trading volume, with a bullish Marubozu suggesting positive sentiment and a bearish Marubozu indicating negative sentiment.
- The bearish Marubozu can signal a potential shift in market sentiment and is a valuable tool for analyzing price action and trading volume dynamics.
- The bullish Marubozu, on the other hand, indicates strong buying demand and suggests a potential continuation of the price trend. Candlestick patterns like Marubozu can help analysts make informed decisions in trading.
Have you ever considered using the famous Marubozu candle in technical analysis? But you need to figure out what it represents or why it’s one of the most important candles in candlestick patterns.
To make big profits in trading, it’s important to understand technical analysis, regardless of your experience. First, this is about the Marubozu candle, whose name is of Japanese origin and means “close-cropped”.
For newcomers and those unfamiliar, it means a candle without a shadow. So, why is this particular candle in technical analysis so crucial to understand? Let’s find out all the basics about her, shall we?
What is the Marubozu candle all about?
A Marubozo represents a specific configuration within candlestick chart analysis. It signals that a security’s price remains confined within the boundaries set by its opening and closing prices. This particular candlestick pattern is characterized by its absence of any shadow.
The Marubozo candlestick has no upper or lower shadows. It helps understand market sentiment, price action, and trading volume. It signifies that a security’s price range remains confined within its opening and closing values.
On up days, where the opening price matches the day’s low and the closing price equals the day’s high, it points to bullish market sentiment, often accompanied by strong trading volume.
Marubozo Candlestick in Market Sentiment, Price Action, and Trading Volume

A bearish Marubozo in a downtrend shows more selling and a shift to negative market sentiment. This happens when a trend is at its highest point, causing more trading declines—a possible pattern that continues.
This candlestick pattern is based on the “real body,” which is the wider part of the candle. It came from Japanese rice traders. This tool analyzes price and trading volume, finding patterns to predict price movements. It’s very useful.
It acts as a gauge for measuring market sentiment by comparing it to the opening and closing prices.
The Bearish Marubozo as a Reversal Indicator
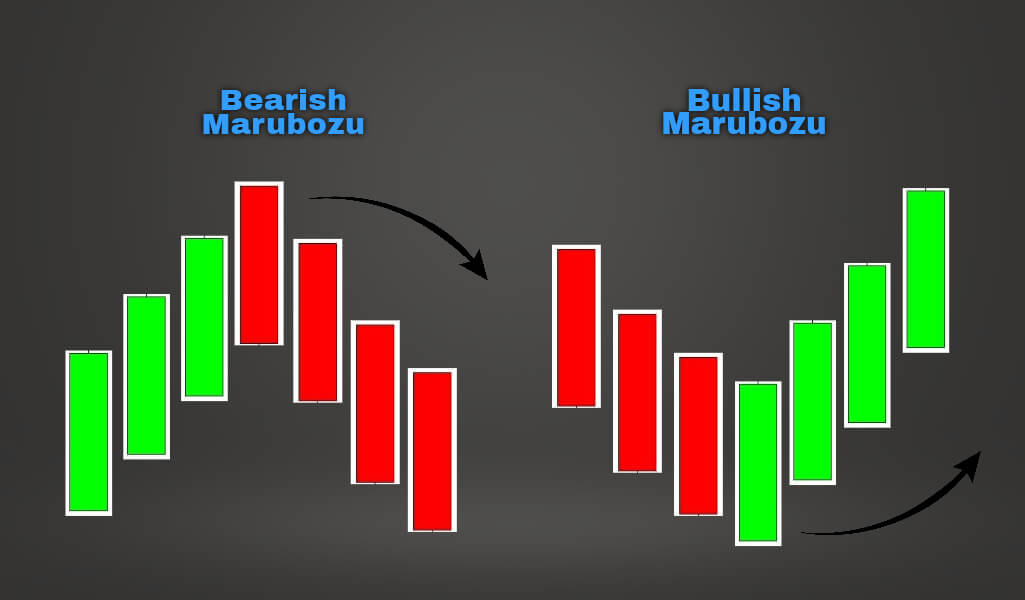
The bearish Marubozo is a signal that indicates a potential shift in market sentiment. It suggests a change from positive to negative during an uptrend.
This analytical tool proves invaluable in dissecting the intricacies of price action and trading volume dynamics, assisting in identifying both continuation patterns and reversal indicators.
This makes it a valuable tool for analyzing price action and trading volume dynamics.
Bearish Marubozu – Explained
Bearish Marubozu is when “Open equals high, and close equals low”. The Bearish Marubozu candlestick pattern signifies a significant shift in market sentiment towards bearishness, regardless of the prior trend.
The security’s starting price is the highest for the day. The ending price is the lowest. This pattern indicates strong selling pressure.
Investors should see the Bearish Marubozu as a bearish signal and search for chances to short. This candlestick pattern suggests that the market sentiment has turned bearish, and there may be a downside potential in the stock’s price.
Bullish Marubozu – Explained

Technical analysts closely monitor candlestick patterns to discern potential price moves and shifts in market sentiment. Marubozu candles are important as they can show both continuation and reversal in patterns.
A Bullish Marubozu is a candlestick pattern where the open and close prices are equal to the low and high prices. This pattern indicates strong buying demand and suggests that the price will continue to rise.
A Bearish Marubozu is a candlestick pattern where the open and close prices equal the high and low prices. This pattern suggests a shift towards bearish sentiment and may signal a potential change in the direction of the price.
Candlestick patterns aid analysts in making wise decisions regarding price movements and market trends.
Using a Marubozu Candlestick Pattern:
Interpretation: A Marubozu White Candle, or a “Bald” or “Shaven Head” Candle, lacks shadows extending from its open or close.
This pattern suggests strong buying interest, as seen when a bullish Marubozu forms at 1820 INR in TCS, closing near its daily high. This can indicate a potential bullish trend continuation over the next few sessions.
Risk-taker vs. Risk-averse:
On the same day, a risk-taker might initiate a trade to acquire shares but could incur a loss the next day if a red candle appears.
In contrast, a risk-averse investor would avoid buying on red candle days, adhering to the rule of buying on blue candle days.
The risk-averse trader would purchase the stock the day after the pattern forms or the following day. They confirm the day’s bullishness before buying to ensure a bullish trend.
The adventurous trader would buy shares on the day the Marubozu forms, quickly verifying its bullishness around market close.
Advantages of the Marubozu Candlestick Pattern

- Strong Trend Indication: The Marubozu candlestick pattern is advantageous for providing a robust indication of market trends. A bullish Marubozu signals a strong uptrend, whereas a bearish Marubozu unmistakably points to a substantial downtrend.
- Easy Trend Identification: Traders find it easy to identify prevailing trends in the market thanks to the pronounced and unmistakable signals that Marubozu provides.
Conclusion
The Marubozu pattern, characterized by its long, wickless body, can hold significance in the context of moving averages, the stock market, and financial markets in general. Depending on its direction, this pattern conveys whether the prevailing trend is bullish or bearish.
It acts as a valuable indicator in one-sided market sentiment, aligning with the principles of technical analysis used in both stock and financial markets.
When observed alongside moving averages, the Marubozu pattern can assist traders and investors in gauging the strength and potential longevity of a trend.
Its message of continuing the prevailing price trend without imminent reversal signs adds an essential layer of insight for decision-making in the dynamic world of financial markets.


