Gold and Silver: The gold marked a new high at $1,825
- Yesterday’s data on the slowdown of inflation in the US pushed the price of gold up to the $1825 level.
- Yesterday’s new high price of silver was at the $24.12 level.
Gold chart analysis
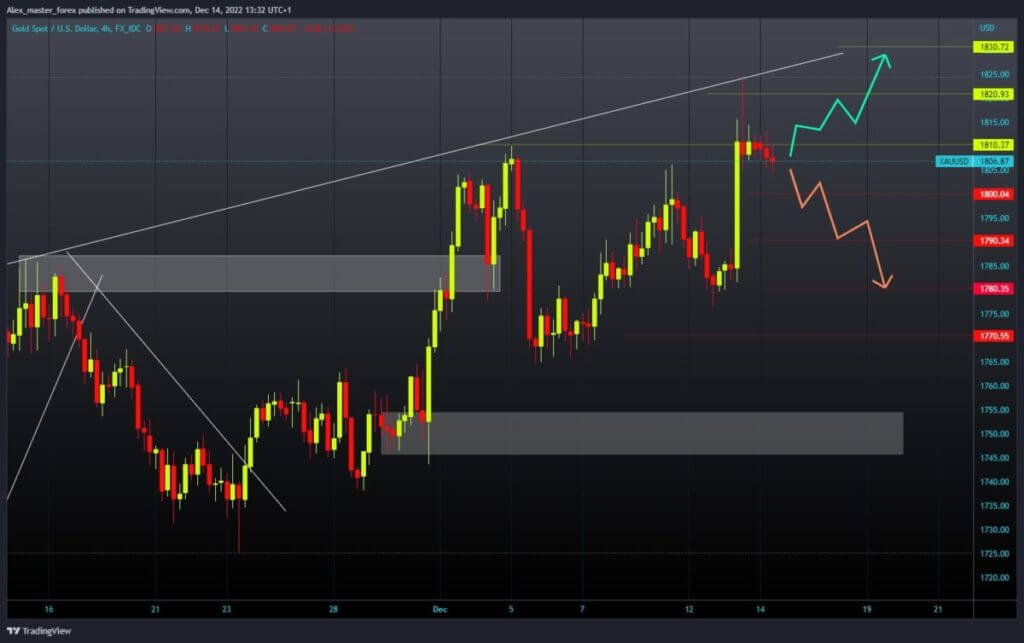
Yesterday’s data on the slowdown of inflation in the US pushed the price of gold up to the $1825 level. A quick pullback followed this to the $1810 level. During the Asian trading session, the price of gold managed to hold on to that level, only to see a slight increase in pressure and a break below this support. The price is currently at the $1805 level and could go down to test the support at the $1800 level.
We need a continuation of the negative consolidation and a break below the $1800 level for a bearish option. If a breakout below occurs, the potential lower targets are $1790 and $1780. For a bullish option, we need a positive consolidation and movement of the gold price to the $1820 level. After that, we could expect a test of the previous high and a potential break above. The first next target is at the $1830 level.

Silver chart analysis
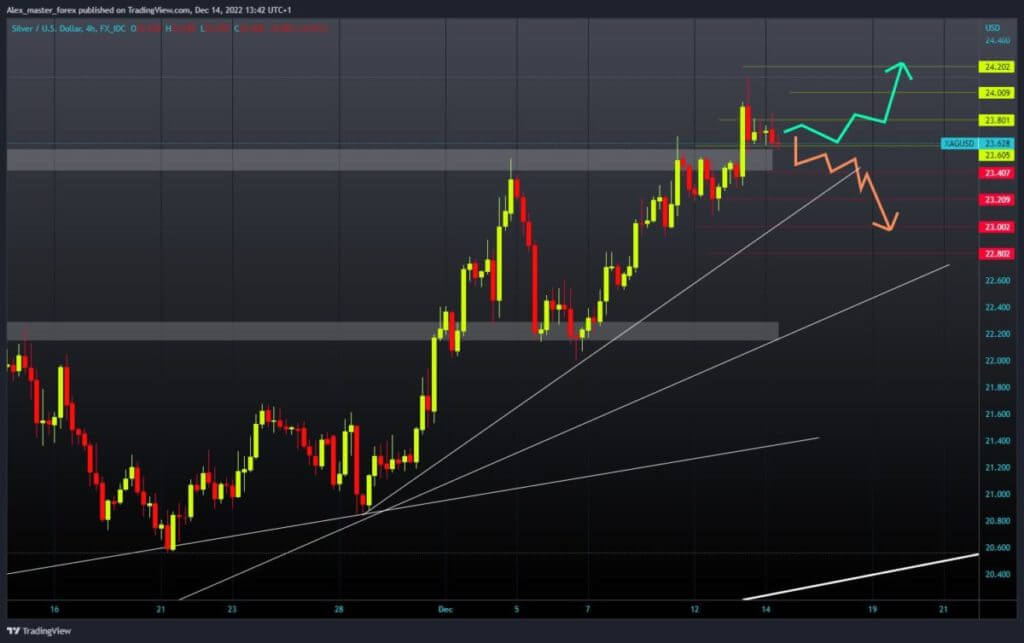
Yesterday’s new high price of silver was at the $24.12 level. The price makes a pullback from that level and finds support at the $23.60 level. During the Asian trading session, the price remained above the $23.60 level. We now have a slight upward pressure on the silver price and could see further pullback below. The next potential support is at the $23.40 level. A break below would only further push the price to lower levels on the chart. Potential lower targets are the $23.20 and $23.00 levels.
We need a positive consolidation and a move above the $23.80 level for a bullish option. With such a move, we would again be close to the $24.00 resistance level. A break above this level and staying up would help us continue on the bullish side. Potential higher targets are the $24.20 and $24.40 levels.


