Gold and Silver: Gold jumps to a new high at $2028
- The price of gold marks a new one-year high at the $2028 level.
- During the Asian session, the price of silver rose to $25.13.
Gold chart analysis
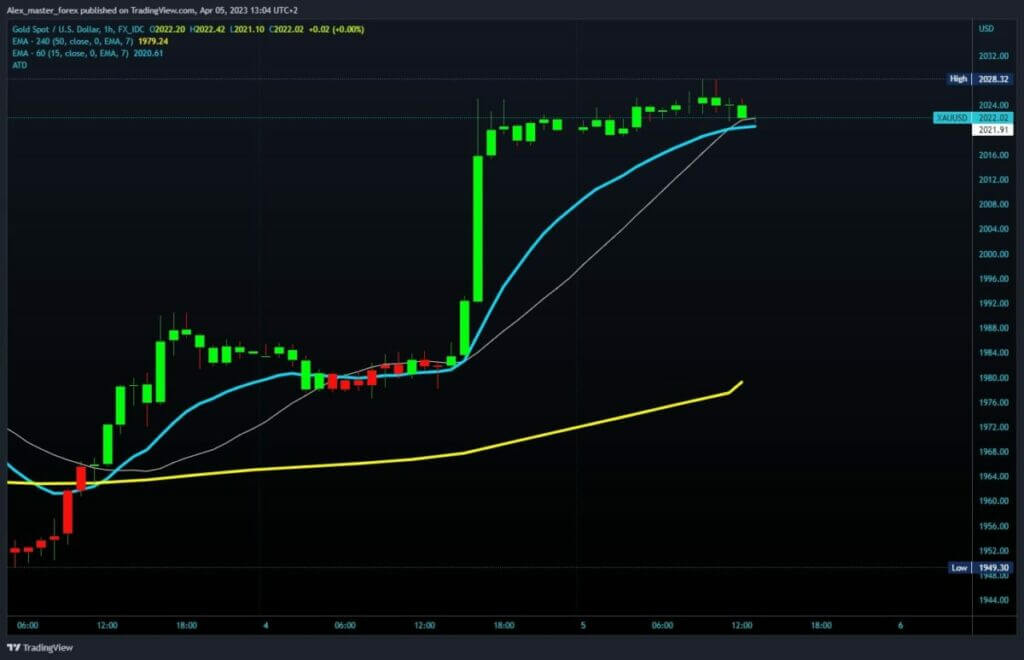
The price of gold marks a new one-year high at the $2028 level. Gold has now retreated to the $2020 level and is trying to find some support there. If it succeeds in this, we could soon see a new bullish impulse and the formation of a new higher high. Potential higher targets are $2030 and $2040 levels. For a bearish option, we need a negative consolidation and price drop to test support at the 2020$ level.
A break below that level would push the price of gold below the EMA15 moving average. Potential lower targets are $2010 and $2000 levels. The decrease in production activity in the USA has worried participants in the financial market that the world’s strongest economy is entering a recession.
Today the ADP data on the change in employment in the USA will be published, and the ISM index of purchasing managers of the service sector will be published in the same USA, which may affect the US dollar and, therefore the price of gold.

Silver chart analysis
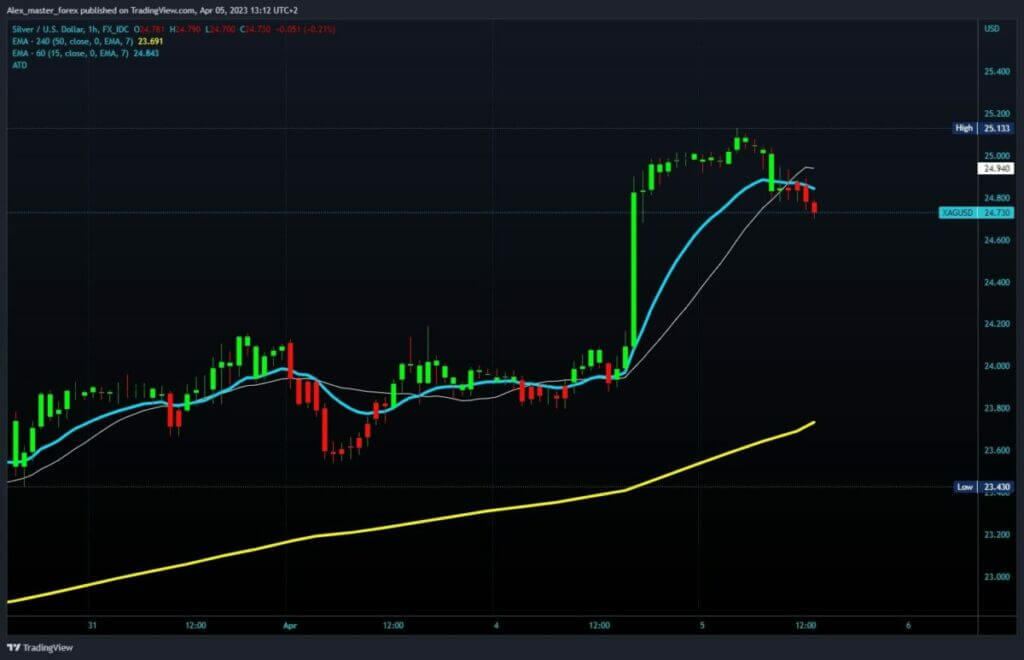
During the Asian session, the price of silver rose to $25.13. After that, we see a pullback below $25.00 and a continuation toward the $24.70 level. We have bearish pressure on the price again, which would lead to a further decline in some potential support. Potential lower targets are the $24.60 and $24.40 levels.
We need a positive consolidation and a return above the $25.00 level for a bullish option. Then we need to stay up there and start the continuation of the recovery with the mob’s impulse. Potential higher targets are the $25.20 and $25.50 levels.


