Gold and silver: Gold is recovering to the $2040 level
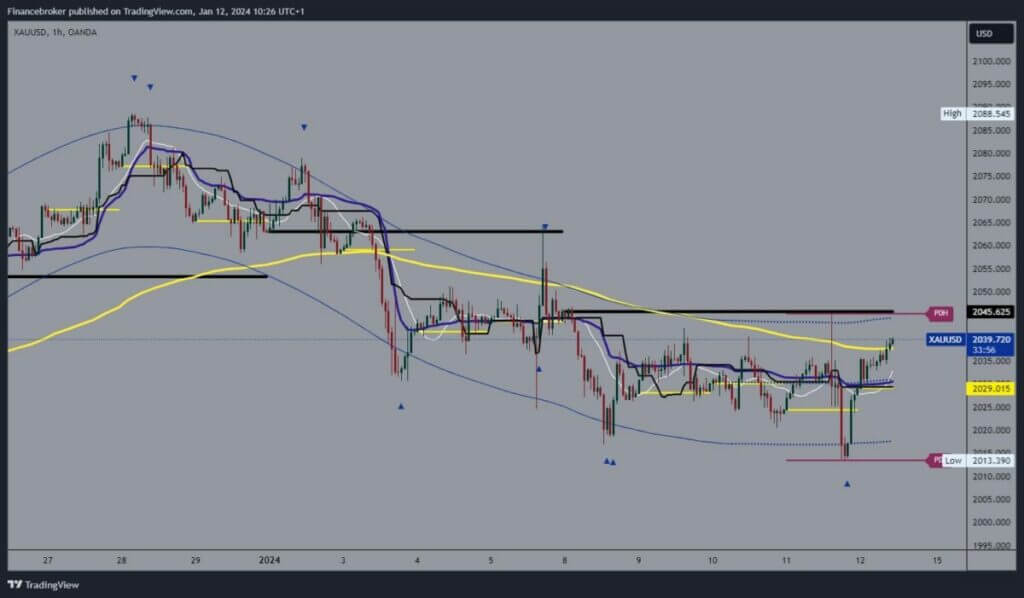
- The price of gold was in retreat this week until yesterday at the 2013$ level.
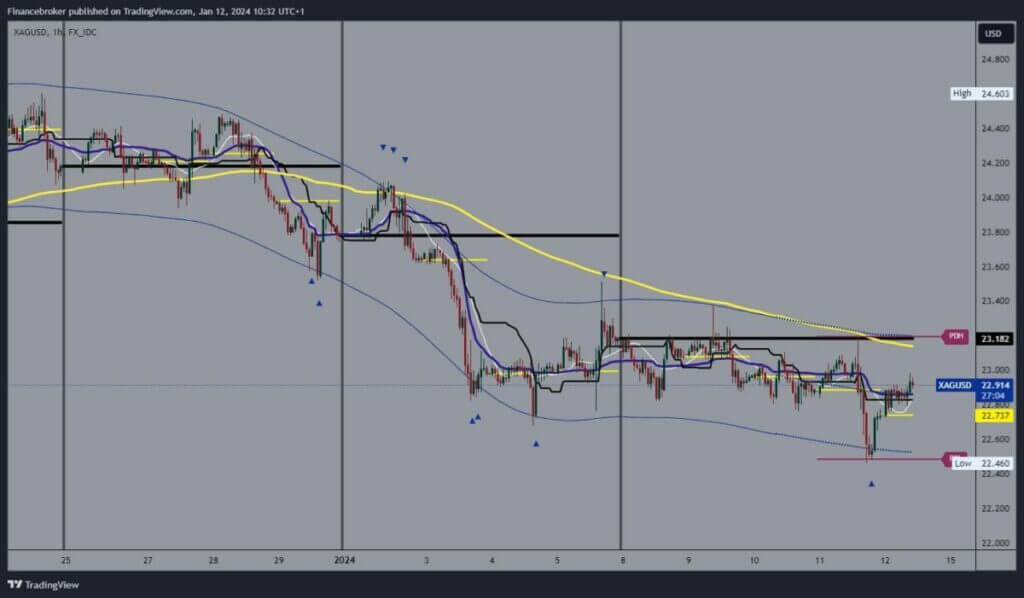
- The price of silver yesterday fell to a new January low at $22.46.
Gold chart analysis
The price of gold was in retreat this week until yesterday at the 2013$ level. The fall is stopped there, and the price starts a recovery. By the end of yesterday, the price returned to the $2027 level. During the Asian trading session, the price continues to recover and crosses above the $2035 level. It is currently at $2039, and we expect to see a jump above the $2040 level soon. We also have support in the EMA50 moving average; potential higher targets are $2045 and $2050.
We need to go back to this morning’s support at the $2030 level for the bearish option. A drop below would mean that the price has no strength for further growth, and we will see a pullback and move to the bearish side. That would move us away from the EMA50 moving average, and potential lower targets are $2025 and $2020.

Silver chart analysis
The price of silver yesterday fell to a new January low at $22.46. After receiving support in that zone, we see a recovery above the $22.70 level. During the Asian trading session, the price managed to hold above and initiate a bullish consolidation above $22.80. We are now on our way to $23.00 and could reach it by the end of the day. Potential higher targets are $23.20 and $23.40 levels.
In the zone around $23.20, we came across the EMA50 moving average, which in the previous two weeks represented resistance to the bullish option. We need a negative consolidation and pullback to the $22.70 support level for a bearish option. A break below shows bearish pressure and a continuation of the silver price pullback. Potential lower targets are $22.60 and $22.40 levels.


