Forex evening star – how to identify this candlestick?
The Forex evening star pattern rarely occurs in charts but is an important and strong bearish reversal signal. It takes place at the top of the market uptrend, signaling a potential reversal. In this article, we dive deeper into this important tech analysis pattern.
In this article, we delve into the following points:
- What does the Evening Star candlestick represent in tech analysis of the market?
- How to spot an Evening Star in the graphic chart
- How to use the Evening Star candlestick in trading
- The accuracy of the evening star signal
What is an evening star?
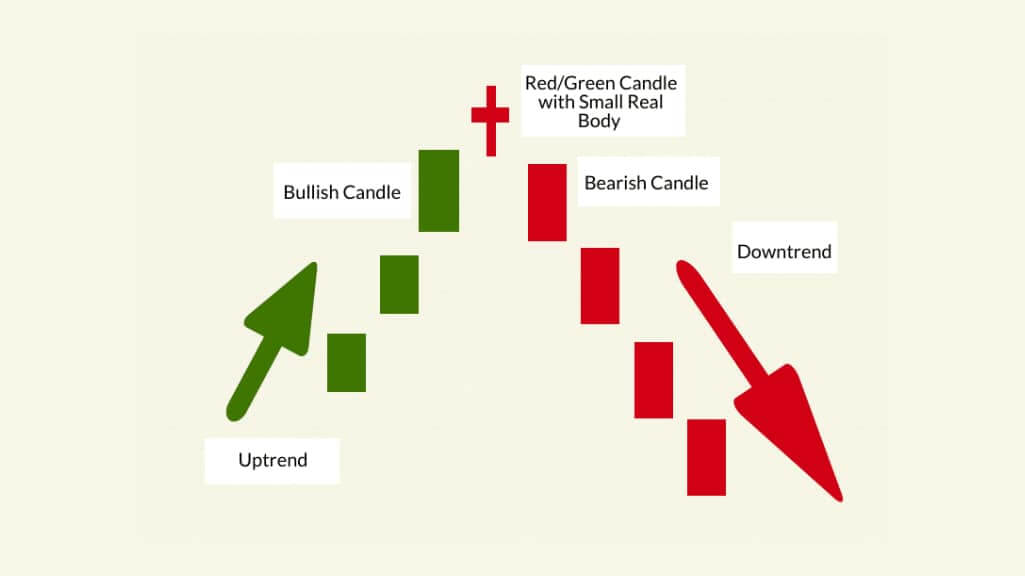
The evening star is a chartist figure which announces a bearish reversal. That is to say, a bearish reversal pattern. Three distinct candles form the evening star:
The first candle is bullish and has a large body.
The second candle can be bullish or bearish (bearish being optimal) and form a bullish gap (the candle’s low is higher than the first candle’s high).
The third candle is bearish with a large body, and it moves back inside the first candle’s body.
Understanding Forex evening start graph formation

Japanese candlesticks are full of information essential to our good reading of the graphs. They show you an asset’s low, high, open, and close price points in a given time frame. The evening star is one of them.
Candlesticks are composed of two wicks and a candle. Their length depends on the range between the lowest and highest price over one trading day. If you spot a long candlestick, it’s a large price movement.
On the contrary, seeing a short candlestick indicates a small change in the asset’s price. In general, long candles show strong buying or selling pressure. It all depends on the trend’s direction.
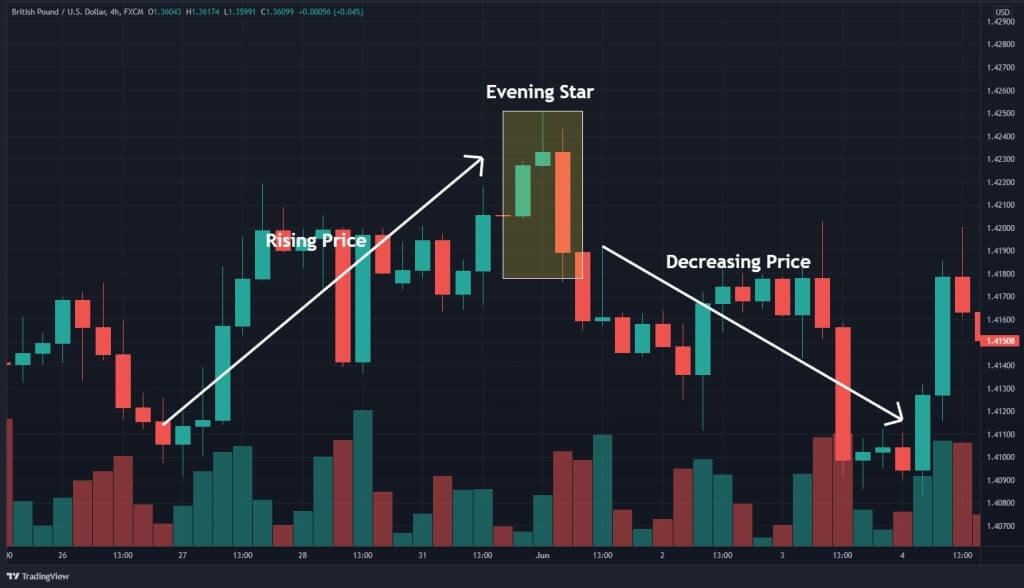
Technical traders consider the evening star a strong indicator of a price decline. This pattern usually forms in a three-day time frame. You will spot large bullish candles on the first day, indicating price rise continuation.
The second day showed a modest increase. On the third day, you will see a large bearish candle and price opening below the second day and closing near the first day’s middle.
Evening Star graph explained.
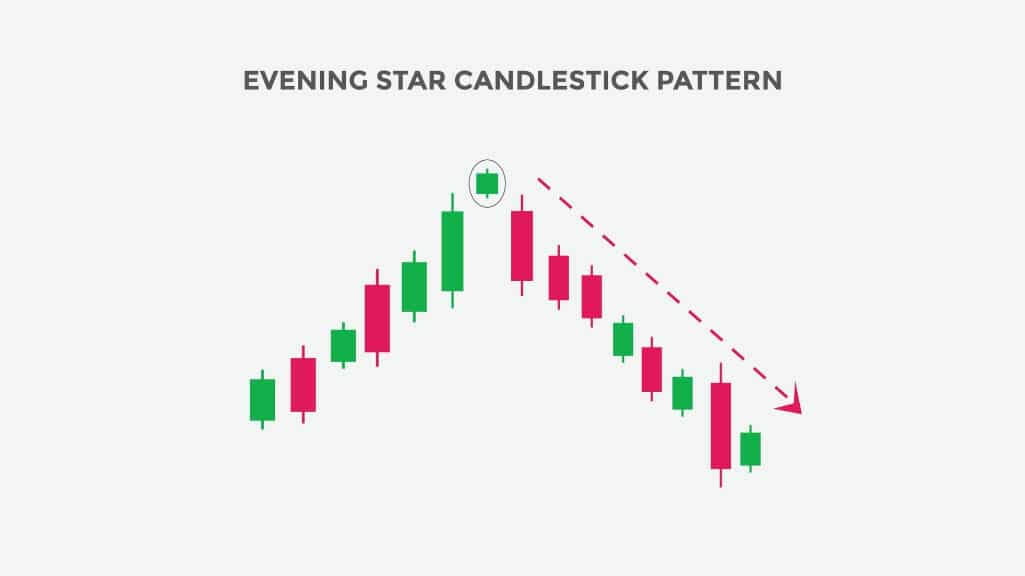
The Evening Star is a powerful and relatively common downward reversal pattern comprising three candlesticks.
The 2nd candlestick is the actual star.
The elements that characterize it are:
The Evening Star occurs following an uptrend.
The 1st candle has a green body.
The 2nd one must draw a bullish gap. It ideally has a small and red candlestick body.
The 3rd one ideally (but not necessarily) traces a bearish gap with a large red body.
Quick reminder: what is the difference between doji and doji star?
In order to identify a Doji candlestick, look for a cross or star pattern. This type of candlestick is unique because it does not have a traditional body; instead, the opening and closing values are equal, with a different high and low.
How to read and trade evening star patterns with the gap?

You can spot this structure the day after a loss, following an uptrend . Prices open higher by creating a gap compared to the previous day’s close.
The next day, you will see that the price opens in a bearish gap and fall to erase a good part of gains on the 1st candlestick. It confirms that the pattern is now bearish.
The same gap is here once gone up and then down, and the shadows of the three Japanese candlesticks do not overlap. It is quite a rare and powerful figure. In Western technical analysis, this is called a “reversal island.”
It should be noted that the 2nd candlestick must obligatorily form a gap with the 1st, but between the 2nd and the 3rd candlestick, the gap is preferable but not obligatory. As for the body of the 2nd candlestick, the color does not matter, even if red remains the ideal.
The larger the gaps, the more reliable the figure will be. Likewise, the more the Doji 3 erases the gains of candlestick 1, the more it will be. Strong trading volumes on the third candlestick can also confirm this pattern.
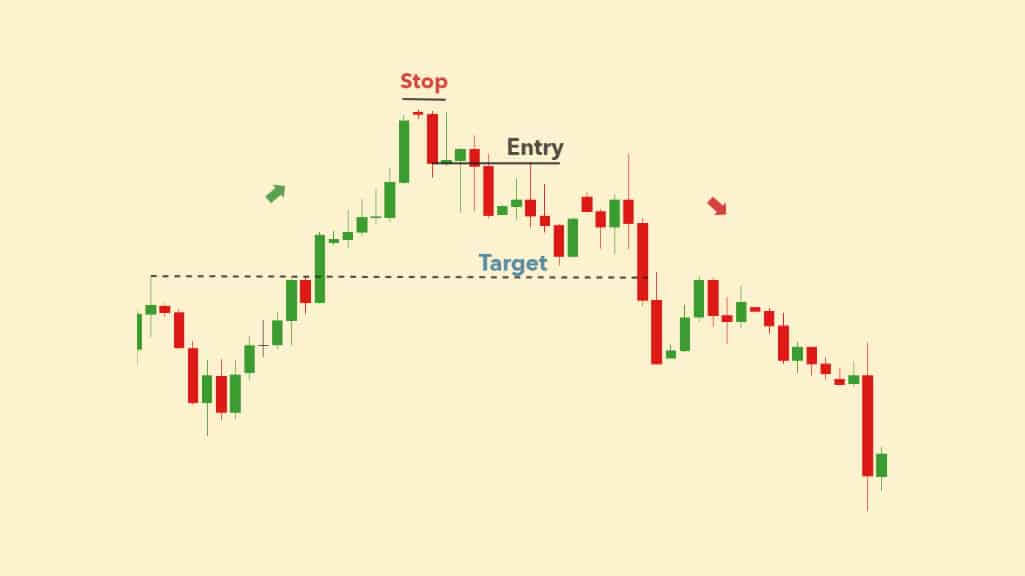
Whatever the quality of the 1 st gap and the star, it will be better to wait for the end of the pattern and for the red body to form to initiate a position.
How to interpret the Forex evening star in trading?
At the time of the evening star formation, the trend is bullish. The first candle, being bullish, shows that it is the buying movement that controls the market. This is the second candle that shows a trend reversal. Indeed, the small body of the candle shows the shortness of the trend. The third candle only validates the downtrend reversal.
The reversal is even more obvious if:
The body of the third candle forms a bearish gap (the candle’s high is lower than the first candle’s low).
The shadows and the body of the second candle are very small
The body of the third candle is very large
The evening star is a strong bearish candle

The evening star is a powerful downward reversal pattern of three candles. It forms at the top of an uptrend. It is a very powerful reversal pattern.
The first must be green and powerful in the continuation of an uptrend. Ideally, the second candle should form an unfilled bullish gap with a small body. This is the star. The third candle pattern should be red and preferably open another gap, but bearish this one.
The power of the evening star will be all the greater as the gaps are wide, the framing candles are powerful, and the star has a small body. A tiny body and two unclosed gaps will form an abandoned baby. Without a gap, the figure remains valid but loses its power.
A star in a doji candle gives even more power to the movement.
If the star has a high shadow twice as large as the body, then we speak of a shooting star.
Combining the observation of reversal patterns with support and resistance lines is interesting.
An evening star can thus sometimes form at the level of resistance and even cross it momentarily without invalidating it and giving rise to a downward reversal.
The evening star has variants. The shooting star is a less powerful one. There is also the Doji evening star, which is a little more powerful than the classic evening star, where the star is made up of a Doji.
Is the Forex evening star a reliable indicator?
It is an accurate and reliable signal showing that the downtrend is coming. But it can be tricky to discern it among asset price data. If you want to spot it accurately, it’s advisable to use trendlines and price oscillators to ensure the evening star has actually occurred.
The evening star pattern should be accompanied by a current trend assessment. Its advantages are many: it frequently occurs, presenting well defined levels for entry and exit. Also, it’s relatively easy to spot. On the other hand, remember that a failed reversal may happen, and the asset price can increase. So the last would be its major limitation.
The bullish version of Forex Evening star

The bullish version of the evening star pattern is the morning star candlestick. Let’s see how this formation is represented in the chart.
What is a morning star pattern in trading?
- The morning star is a chart pattern that announces a reversal of the bottom. That is to say, a bullish reversal pattern. Three separate candles form the Morning Star:
- The first candle is bearish and has a large body.
- The second candle can be bullish or bearish (bullish being optimal) and form a bearish gap (the candle’s high is lower than the first candle’s low).
- The third candle is bullish with a large body, and it moves back inside the body of the first candle.
How to interpret the morning star in trading?
It’s a strong bullish candle. The trend is bearish at the moment of the morning star’s formation. The first candle, being bearish, shows that it is indeed the selling movement that controls the market. The second candle that shows a trend reversal. Indeed, the small body of the candle shows that the trend is running out of steam.
The third candle only validates the trend reversal. The reversal is even more obvious if:
The body of the third candle forms a bullish gap (the candle’s low is higher than the previous candle’s high. The shadows and the body of the second candle are very small. The body of the third candle is very large
Conclusion – Forex Evening star
Forex evening stars rarely occur in tech analysis charts. But it’s a strong and reliable signal for the trend reversal in Forex and other financial markets. The opposite of the evening star is the morning star pattern, in which case we have a bearish reversal trend. It’s advisable to combine this signal with oscillator indicators and trendlines to get more accurate price action predictions.
Forex evening star – frequently asked questions (FAQ)

What is an evening star in Forex?
The evening star is a chartist figure which announces a bearish reversal.
Is an evening star a reliable indicator?
Technical traders consider the evening star a strong indicator of a price decline. This pattern usually forms in a three-day time frame. You will spot large bullish candles on the first day, indicating price rise continuation. The second day showed a modest increase. On the third day, you will see a large bearish candle and price opening below the second day and closing near the first day’s middle.
What is a bullish evening star?
The bullish version of the evening star pattern is the morning star candlestick. It’s a strong bullish candle.
How to interpret the Forex evening star?
At the time of the evening star formation, the trend is bullish. The first candle, being bullish, shows that it is the buying movement that controls the market. This is the second candle that shows a trend reversal. Indeed, the small body of the candle shows the shortness of the trend. The third candle only validates the downtrend reversal.The reversal is even more obvious if
the body of the third candle forms a bearish gap


