EURAUD Breaking Lower: Analyzing the 1.64800 Pullback
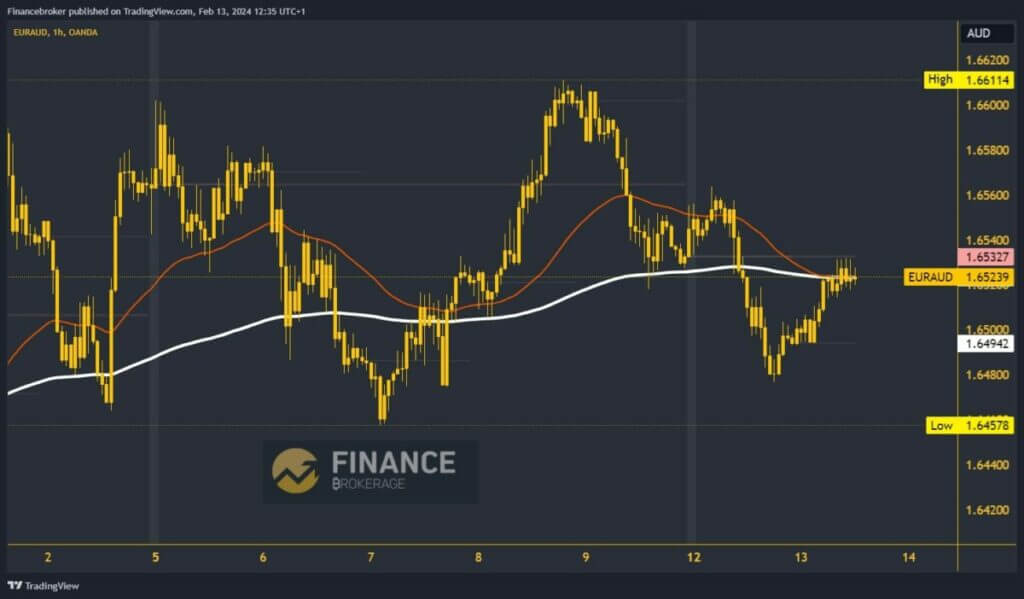
- On Friday, the EURAUD managed to maintain itself above the 1.65250 level and found support there.
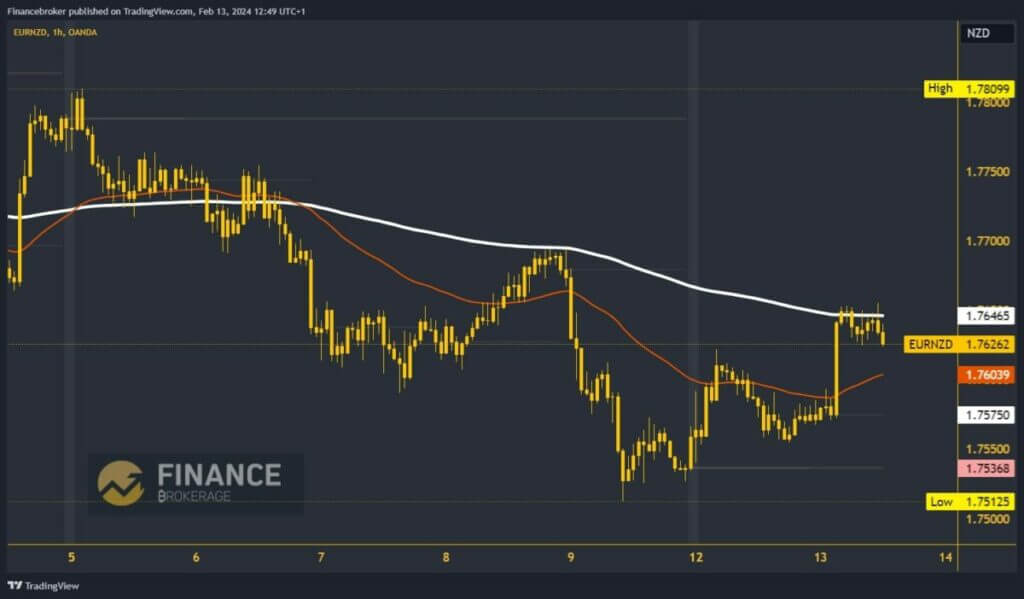
- On Friday, we saw EURNZD fall to the 1.75125 level.
EURAUD chart analysis
On Friday, the EURAUD managed to maintain itself above the 1.65250 level and found support there. We had additional support in the EMA200 moving average, and the pair managed to use it and recover to the 1.65600 level. Not long after that, we encounter resistance and begin a pullback to the 1.64800 level. With this, we form a lower low compared to Friday, which increases the chances of a further pullback.
During the previous Asian trading session, EURAUD started a recovery, rising to the 1.65400 level, where we are now testing the EMA200 moving average. If we manage to break above, we will have the opportunity to test this week’s high at the 1.65600 level. Potential higher targets are 1.65800 and 1.66000 levels.

EURNZD chart analysis
On Friday, we saw EURNZD fall to the 1.75125 level. The pair receives the requested support and starts a recovery from that level. During the Asian trading session, we got support at the 1.75800 level and jumped to the 1.76500 level with a strong impulse. Here, we encounter the EMA200 moving average, which stops us and does not allow us to break above.
If we manage to move above, potential higher targets are 1.76600 and 1.76800 levels. We need a negative consolidation and a drop below the 1.76250 level for a bearish option. With that move, we would move away from the EMA200 and begin a pullback with the aim of looking for support at lower levels. Potential initial targets are 1.76000 and 1.75500 levels.


