


Diamond Continuation Pattern – All That You Need To Know
Have you ever wondered what the Diamond Continuation Pattern is and why you need to know how to identify it? Compared to many other patterns, how will it greatly help you in trading?
First of all, the more you know about trading patterns, such as the continuation diamond pattern, the more chances you have to rise above the competition and, with their help, achieve the desired profits most effectively and quickly.
But what does the Continuation Diamond Chart Pattern actually mean? How can you best spot it, interpret it and use it for trading? Let’s get to the nitty-gritty, shall we?
The Diamond Continuation Definition and explanation

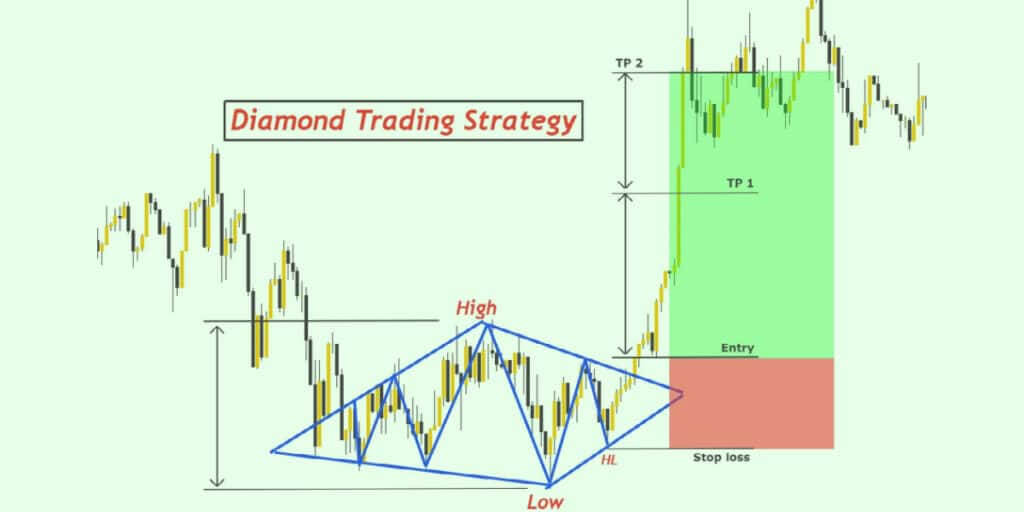
Diamond Continuation Pattern represents a distinctive pattern or formation on charts once the price breaks out of a consolidation phase and continues an uptrend. This pattern starts with a downtrend, during which prices from lower lows and higher highs are in an expanded pattern.
As the trading range contracts, the high-level peaks and lows begin to trend upwards. The key indication of the Diamond Continuation Pattern is once the price manages to break out of the boundary lines of the Diamond. It’s doing so by signaling the renewal of the previous uptrend.
Diamond formation – a relatively rare occurrence
It is crucial for traders to use other technical analysis tools in conjunction with the Diamond formation to confirm the continuation of the uptrend. Moreover, it is essential to be aware that Diamond formation is a relatively rare occurrence in the financial markets and should be used in combination with other signals to make a trading decision.
Traders are able to utilize the Diamond Continuation Pattern as a confirmation signal of a trend reversal or as a reversal pattern that confirms the continuation of the past trend.
The pattern won’t always indicate a trend reversal or continuation.
It is crucial to remember that the Diamond formation is not a foolproof pattern and may not always indicate a trend reversal or continuation. To ensure a sound trading decision, it is essential to utilize a variety of technical analysis tools together with the Diamond formation to confirm the trend.
In addition, it is also crucial to pay attention to the volume of trading during the Diamond formation. The reason for that is that a significantly high volume during the Diamond pattern breakout can provide added confirmation of the continuation of the uptrend.
Furthermore, the diamond formation size should also be considered, as larger diamond patterns typically indicate a stronger trend than smaller ones.
How to identify the Diamond Continuation Pattern?

Once you’re about to identify the famous Continuation Diamond Chart Pattern, remember that the symmetry of the pattern is a crucial aspect to consider. When lows and highs are somewhat symmetrical, and the pattern’s lines are parallel, this Diamond Continuation Pattern is taken into account as more trustworthy.
What’s also essential to note is that this particular pattern usually forms over an interval of several months. Thus, it is not suitable for short-term trading. Besides this aspect, it’s crucial for traders to keep in mind that the Diamond formation is either bearish or bullish. It depends solely on the conditions in the market, along with other indicators.
Paying attention to the volume
It’s also essential for traders to pay attention to the different volume levels. A decrease in volume throughout the pattern’s formation and an increase in volume during the famous breakout means that the Diamond Continuation Pattern is probably more accurate.
Using multiple technical analysis tools and indicators in conjunction with the Diamond formation is crucial to confirm the trend and make a trading decision. When interpreting the Diamond pattern, it is also essential to be mindful of the broader market context.
Where can this Diamond Chart Pattern be used?

It’s important to understand where the Diamond chart pattern is best utilized. There are various ways in trading where this pattern could be used. Here is what it all includes:
Doing a proper identification of the continuation of an existing trend.
The Continuation Diamond chart pattern refers to a continuation signal. It indicates that the present trend is expected to continue. This particular pattern is utilized by traders who wish to confirm the uptrend and search for potential buying opportunities in the market.
Defining both entry and exit points
The Diamond Pattern breakout could enable an excellent entry point for a single trade. This pattern’s resistance level can also serve as a target for acquiring profits. The Diamond Continuation Pattern’s support level can also be utilized as a stop-loss level to restrict potential losses.
Risk management
Remember that the Continuation Diamond Chart Pattern is also able to assist in managing risk. It’s able to do so by permitting traders to establish thigh stop-loss levels which are solely based on the support levels of the pattern.
Diversification of the portfolio
This pattern is able to assist traders in identifying valuable opportunities in diverse markets and asset classes. It’s all crucial in helping traders to diversify their portfolios and manage their risks in the market in the long run.
Market Timing
The Diamond Continuation Pattern is also able to be utilized to do a proper market timing. It’s able to do so by recognizing potential selling or buying opportunities based on the breakout of the pattern.
What should be remembered is that this pattern should be utilized together with other technical analysis tools to confirm a certain trend. That will assist in making a trading decision since the pattern itself isn’t a sufficient indicator.
Continuation Diamond Bullish Pattern – get the essentials.

The Continuation Diamond Bullish Pattern represents a bullish signal that indicates that the present trend is likely to continue. Typically, Diamond patterns are established during a couple of months in extremely active markets. Throughout the formation of the Continuation Diamond Bullish Pattern, the volume will stay high.
As previously stated, Diamond patterns are characterized by the formation of increasingly elevated peaks and lower troughs in a pattern that widens over time. As the trading range tightens, the peaks and troughs begin to trend upward.
When prices break out of the Diamond formation and move upwards, it can signal a continuation of the previous uptrend, indicating a potential trading opportunity for traders.
Furthermore, it is vital to keep in mind that Diamond patterns are not always reliable, and traders should use other technical analysis tools in conjunction with the Diamond pattern to confirm the trend and make a trading decision.
What is a Diamond Top Pattern exactly?
Now that you’ve all the essential information about the Diamond continuation pattern, it’s time to learn what the Diamond Top Pattern represents. This particular pattern refers to a technical analysis pattern. A solid uptrend typically leads it up.
The Diamond Top Pattern forms a series of lower lows and higher highs, and afterward, the higher and lower highs on the particular price chart. Traders are able to spot a diamond shape on the chart by connecting these minor lows and highs and drawing trend lines. For that particular reason, it’s called a “Diamond Top Chart Pattern.”

When is the formation of this pattern complete?
This particular chart pattern is formed once the price action is below the lower trendline. It can also be completed once the stock price shuts outside it. Please pay attention to the volume that is vital in its creation.
The volume should increase solidly during the bullish move that sets the scene for the formation. After that, it will sharply decline until the expected breakdown happens. As a result of the exhausted buying force and the influx of sellers taking control of the market momentum, prices fall significantly once the selling pressure is unleashed.
This further confirms the move’s strength and makes it more likely that the decline will continue. The volume then increases and remains elevated throughout the downward breakout for several days.
How to trade the Diamond Top Pattern?
The Diamond Top pattern is best traded once you rely on and follow its breakout direction. In other words, traders are able to sell once the price gets beneath the lower trendline. Also, they’re able to purchase once it breaks out high up the upper trendline.
Summary
The Continuation Diamond Chart is a unique formation that appears on charts when the price breaks out of a consolidation phase and continues an upward trend. This pattern begins with a downward trend, during which prices create decreasing lows and increasing highs in an expanded pattern. As the trading range narrows, the highest and lowest points begin to trend upwards.
The key indication of this pattern is when the price surpasses the boundaries of the Diamond, signaling the continuation of the previous uptrend. It is important to note that the Continuation Diamond Chart is only sometimes a reliable pattern, and traders should use other technical analysis tools in conjunction with it to confirm the trend and make a trading decision.
In addition, traders should pay attention to the volume of trading during the Continuation Diamond Chart formation, as high volume during the breakout of the pattern can provide added confirmation of the continuation of the uptrend.

