Bitcoin remains stable above the $60,000 level on Friday
- On Wednesday, the price of Bitcoin climbed to the $64,000 level.
Bitcoin chart analysis
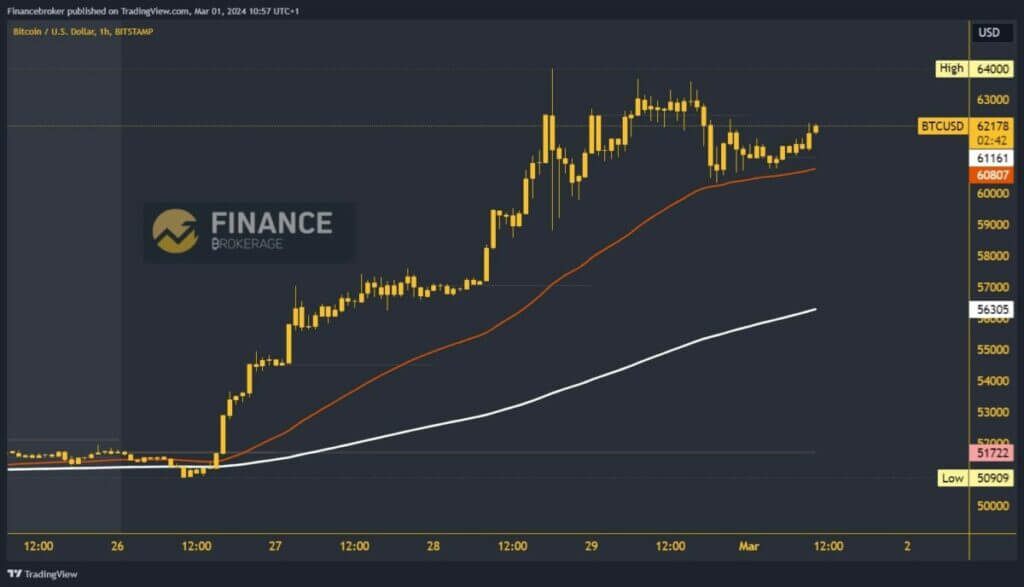
On Wednesday, the price of Bitcoin climbed to the $64,000 level. This was followed by a pullback, so yesterday, we were looking at a sideways movement in the $60400-$63300 range. We started the morning at $61100 and have been in a mild bullish consolidation ever since. The price has moved above the $62000 level and is moving slowly to the bullish side.
We expect the first resistance at the $63,000 level. It will be a good test for us because if we skip it, a new bullish impulse could follow, which would cross over the weekly high and form a new one. Potential higher targets are $64500 and $65000 levels. With this, we climb to the levels from November 2021 and approach the all-time high price of $69,000.

Are we staying in a bullish rally, or are we in for a price drop?
We need to go back to support at the $60,000 level for a bearish option. A break below that price would shake the chart significantly, moving us away from the weekly high. This leads to an increase in bearish momentum, and a strong bearish impulse could occur.
The next important level is $59,000 because, on Wednesday, we went back down and tested that level after the jump. Potential lower targets are the $58,000 and $57,000 levels. The EMA200 moving average lags behind this bullish rally and is in the zone around the $56300 level. This week’s low price was on Monday at the $50909 level.


