Bitcoin remains on the positive side above the $70,000 level
- Yesterday and today, the price of Bitcoin spent a good part of the time above the $70,000 level.
Bitcoin chart analysis
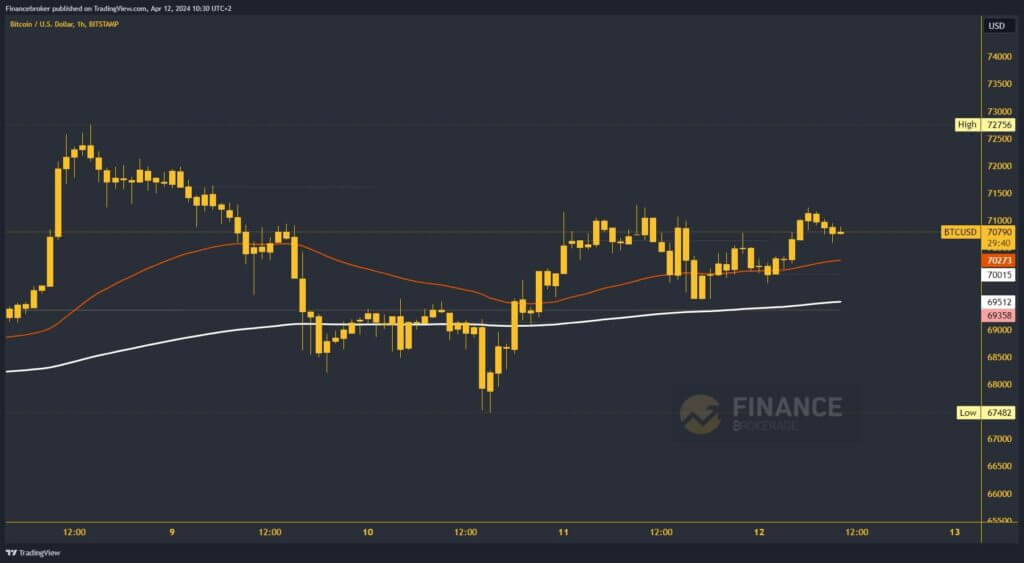
Yesterday and today, the price of Bitcoin spent a good part of the time above the $70,000 level. We have been stabilizing above that level for a longer time, and it is only a question of when we will see a new bullish impulse. We are currently at the $70,900 level and need a bit to move above the $71,000 level. We have a stronger resistance at $71200 and crossing above it opens up an empty space to the bullish side.
Potential higher targets are $71500 and $72000 levels. This brings us back to the resistance zone from the beginning of this week, and we may be able to test the weekly high at the $72756 level. We have good support from EMA50 and EMA200 moving averages, which supports our bullish option.

We still remain in the zone around the $70,000 level with the support of the EMA200.
If Bitcoin begins to lose strength and turn to the bearish side, we first look at the $70,000 level again. Falling below, we descend into the EMA200 zone at the $69500 level. This is where we expect to get moving average support or at least slow Bitcoin’s pullback.
At $69358, we test the weekly open price and if it does not hold, we move below to the bearish side. It only reinforces the negative picture for Bitcoin and increases the chances of us seeing a deeper pullback. Potential lower targets are the $69,000 and $68,500 levels.


