Bitcoin price remains above the $69,000 support level
- The price of Bitcoin rose to $72,756 on Monday.
Bitcoin chart analysis
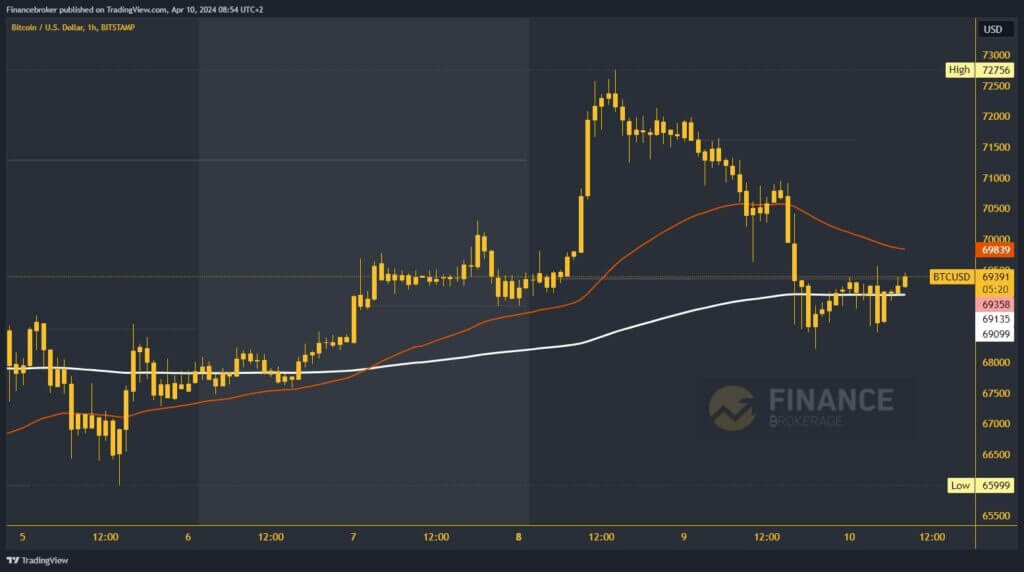
The price of Bitcoin rose to $72,756 on Monday. We stopped there, and the price did not have the strength to continue further, and a pullback followed. By the end of the day, we were back below $72,000, looking for support at the $71,500 level. On Tuesday, the price continues to pull back, heading towards $71,000. We don’t get the requested support there either, but we continue down to the $70,000 level.
There, we form the first low, from which we recover to the $71,000 level. Now, here we encounter resistance, and with three bearish impulses, we fell all the way to the $68200 level. We also broke below the EMA200 moving average, which further increased the pressure on the weakened Bitcoin. We found the strength to hold above that level and return above the EMA200 to the $69500 level.

Does Bitcoin have the strength to go back to the bullish side again?
Our goal is to stay above this support to initiate a new bullish consolidation and move above the $70,000 level. In that zone, we encounter the EMA50 moving average, and with its support, it will be much easier for us to continue on the bullish side. Potential higher targets are $70500 and $71000 levels.
We need a negative consolidation and pullback again below the EMA200 and $69000 levels for a bearish option. After that, we will be forced to test yesterday’s support zone again. A further drop into it would only increase the bearish pressure on Bitcoin, and we would probably see a break below a new weekly low. Potential lower targets are the $68,000 and $67,500 levels.


