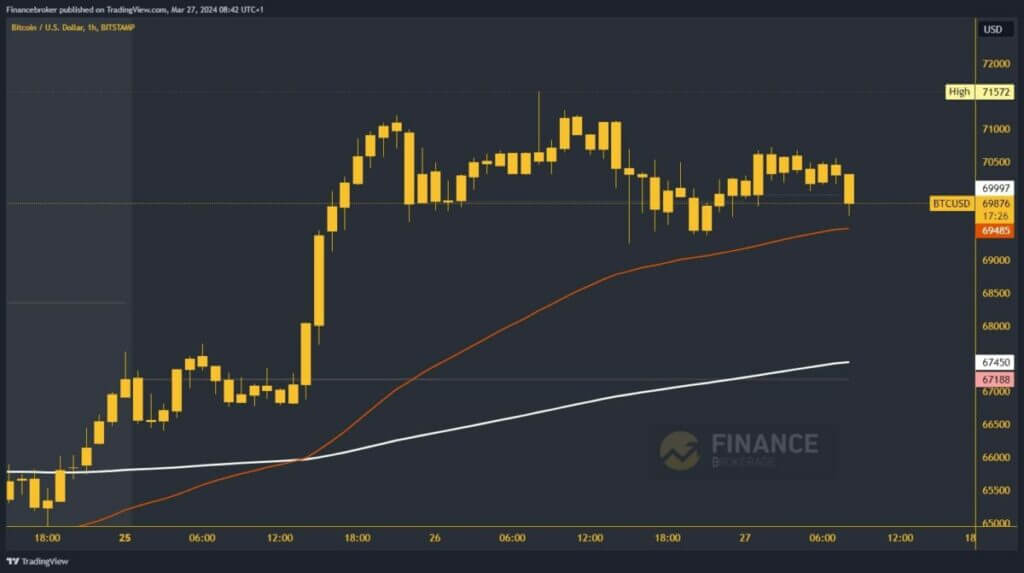
Bitcoin price is trying to hold above the $69500 level
- This week’s high price of Bitcoin was formed yesterday at the $71572 level.
Bitcoin chart analysis
This week’s high price of Bitcoin was formed yesterday at the $71572 level. After that, we returned below $71000 and started a pullback to support at $69400. We managed to hold above that level and initiate a bullish consolidation again above $70,000. This morning, we are climbing to the $70740 level, and for now, we have resistance there to continue on the bullish side.
Bitcoin takes a step down and retreats below the $70,000 level. We are currently seeing a bearish impulse that could take us down to test last night’s support level. Additional price support in that zone is the EMA50 moving average. We will be under more pressure in that zone, and a drop below to a new daily low could easily happen.
Do we go below $69000 by the end of this week again?
Potential lower targets are the $69,000 and $68,500 levels. The EMA200 moving average is even lower in the zone, around $67500. We are approaching the weekly open price there, and it will be interesting to watch how Bitcoin will behave in that zone if we go down.
We need a positive consolidation and a return around the $71000 level for a bullish option. Thus, we climb to a new daily high and receive confirmation of bullish momentum. Then, we need to hold up there and initiate a new consolidation from there to the $71500 level. There we test the weekly high and hopefully move above to a new one and continue to the bullish side. Potential higher targets are $72000 and $72500 levels.


