Bitcoin and Ethereum prices are slowly rising
Bitcoin chart analysis
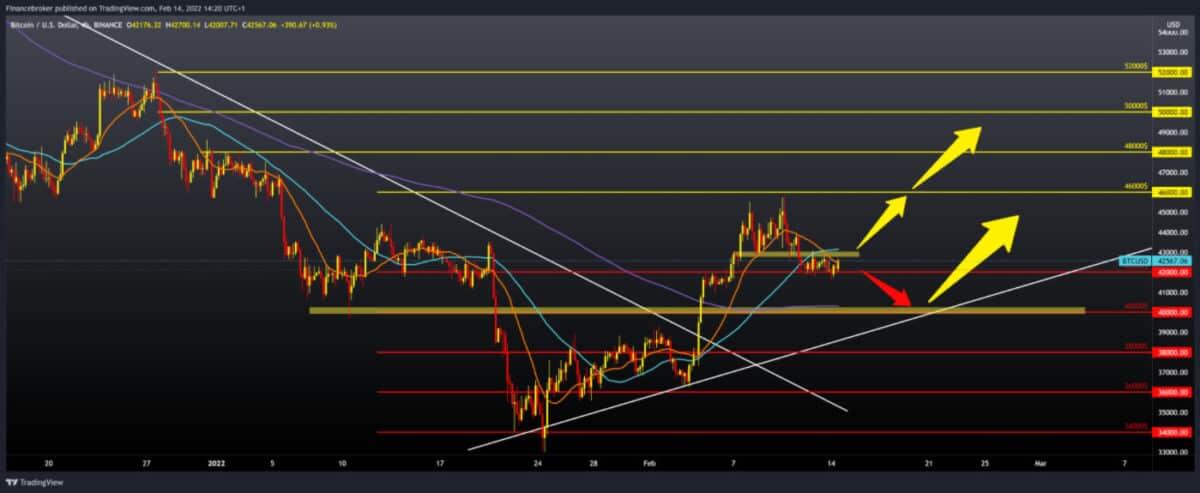
Over the weekend, the price of Bitcoin ranged from 41,600-43,000 dollars. For now, we are stable above $ 42,000, and if the current consolidation continues, we can expect the price to revisit the $ 43,000 price and try to make a more concrete break above the $ 44,000-45,000. The dollar index is currently stagnant, which could help the price of bitcoin rise to higher levels on the chart.
Bullish scenario:
- We need a break above this current side consolidation.
- Break would help us because MA20 and MA50 would move to the bullish side and give price support.
- After that, our first target is the $ 44,000 level, and the next is at $ 45,000.
- Last week, we twice tried to break the barrier to $ 45,000, but without success.
- If we break, our following targets would be $ 46,000, then $ 48,000 instead of the December consolidation.
- Our main target and resistance is the $ 50,000-52,000 zone.
Bearish scenario:
- We need negative consolidation and a price withdrawal below $ 42,000, and after that, we could let go of the $ 40,000 support zone.
- Additional support at $ 40,000 is the MA200 moving average.
- If the price declines from the MA200, then we can say that the price has done a retest and that we can expect a better recovery and a potential bullish trend.
- In the second case, a break below would lower the price to $ 38,000-39,000, which would test the bottom trend line formed from January 24.
- A fall below the trend line would force the price to seek lower support. First at $ 38,000, then $ 36,000, and the previous low from January at $ 34,000.

Ethereum chart analysis
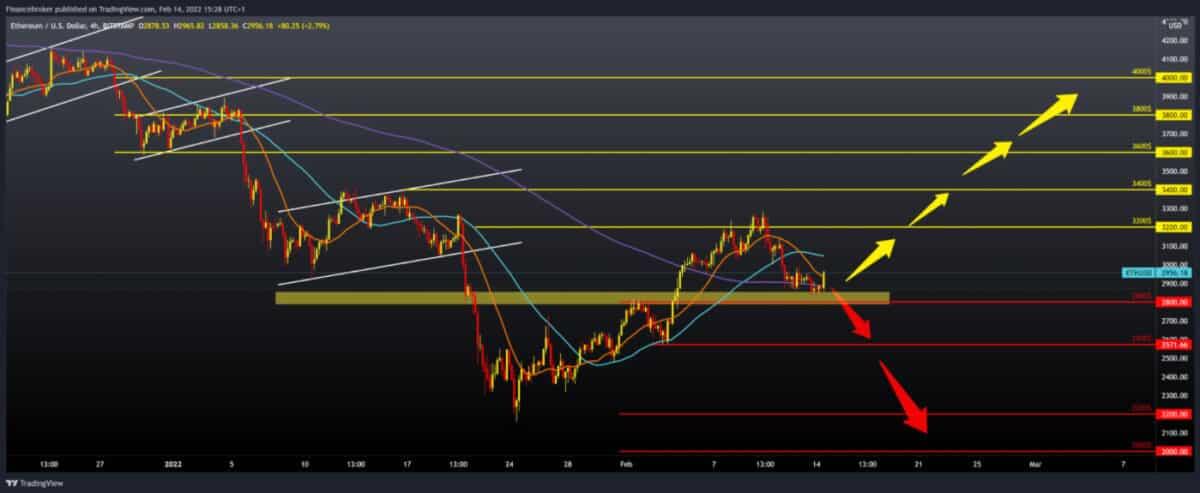
The price of Ethereum immediately at the weekend was in the consolidation of 2800-3000 dollars. Today, ETH found support again at $ 2800, and after that, we have the current bullish momentum, which pushed the price up to $ 2960. If we follow the moving averages, we see that they are in the range of 2900-3050 dollars, and we need a break above MA50 which will boost bullish optimism.
Bullish scenario:
- We need a continuation of the current positive consolidation.
- After that, we need a break above the MA50 and $ 3050 price.
- Then we get the support of all moving averages, and we can expect a further continuation to the previous high at $ 3,200.
- If the bullish impulse continues, our next target is the $ 3400 level, the last time we were there was on January 13th.
- The price break above climbs us to resistance at $ 3600, and here we are close to this year’s high at $ 3800 from January 4th.
Bearish scenario:
- We need negative consolidation and a price withdrawal below $ 2,800 and the MA200 moving average.
- Breaking prices below this support would increase bearish pressure.
- Our first lower support is the February minimum at the $ 2570 level.
- And if he doesn’t make it, we can expect a further drop to $ 2,500, then support to $ 2,400.
- Our maximum short-term pullback is up to potential support up to $ 2,200.

-
Support
-
Platform
-
Spread
-
Trading Instrument


