


Bitcoin and Ethereum on previous support
Bitcoin analysis
Bitcoin and the impact of mining and energy consumption
The new CoinShares report highlights recent cryptocurrency carbon emissions, which are nearly 0.08% globally, insignificant figures compared to emissions emitted by other industries and domains.
The CoinShare report also revealed the latest statistics using Galaxy Digital’s estimate that energy consumption for Bitcoin mining is far lower than other financial systems such as gold and the banking industry.
The CoinShare study further claims that Bitcoin mining contributed nearly 42 megatons of carbon emissions in 2021 compared to other countries such as China and the US, which contributed much more in terms of numbers and statistics.
As a frame of reference, countries with big industrial bases such as the United States and China emitted 5,830Mt and 11,580Mt of CO2 in 2016,” the CoinShares report said.
The report also states that the CO2 emissions released by Bitcoin mining are very “insignificant.”
“While it is clear that there are currently emissions that result from bitcoin mining, these emissions are not only insignificant globally, but are in themselves in no way necessary,” CoinShares added.
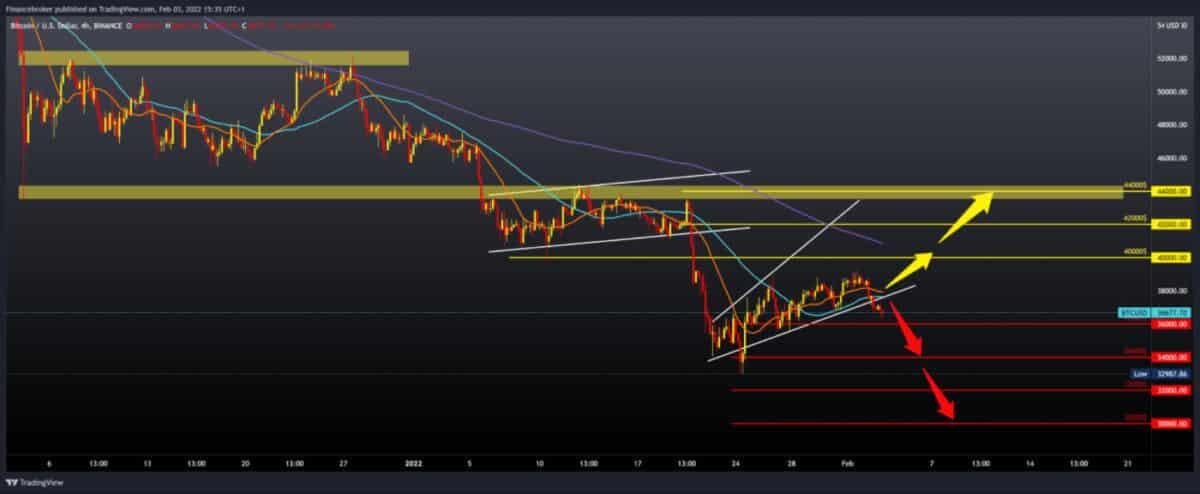
BTC chart view
The price of Bitcoin broke our trend line of support this morning and dropped to $ 36,250. The moving averages of the MA20 and MA50 are now on the bearish side and are stepping up pressure on the price to fall to the following levels of support. Buyers can never raise the price above $ 40,000 and thus increase such shaken optimism in quick price recovery.
Bullish scenario:
- We need a new positive consolidation and a return on prices above $ 38,000. After that, we go back above the trend line and look for support in the MA20 and MA50 moving averages.
- Further bullish momentum leads us to the previous high at the $ 39,000 February high.
- Our next resistance is around $ 41,000, along with the MA200 moving average, and we need a break above if we expect a more bullish severe sequel.
Bearish scenario:
- We need to continue the current negative consolidation and further pullback the price below $ 36,000.
- After that, our next support is at $ 35,000, then at $ 34,000.
- And if those supports don’t hold up, we move on to this year’s low of $ 32,987.
- The break below will open new lows for us this year.

Ethereum chart analysis
The price of Ethereum is in a small withdrawal to the support zone, around $ 2600. It is still in a growing channel, and we can say that this is just a consolidation within the channel because, for now, there are no jumps outside its lines.
Additional potential support can be provided by the Ma20 and MA50 moving averages so that with the next bullish impulse, we can climb again in the zone around $ 2800.
Bullish scenario:
- We need a new positive consolidation, and with moving averages, we make a new turn to the bullish side.
- Below our first resistance is the $ 2800 zone, which we failed to skip in a previous attempt.
- The next resistance is the psychological $ 3,000, where we come across the MA200 moving average.
- If the price succeeds in passing above, our next targets are $ 3,200 and then $ 3,400.
Bearish scenario:
- We need to continue this negative consolidation and pullback the price below $ 2600.
- At $ 2,500, we come across the channel’s bottom line, and a break below would heighten bearish pressure.
- Our next support is at $ 2,200, and we are very close to this year’s low of $ 2,160.
- In the continuation of this negative consolidation, we go lower to the psychological level at $ 2,000.

-
Support
-
Platform
-
Spread
-
Trading Instrument

