A strong bitcoin return should meet with a possible rejection “if the price rises to $ 40,000. Bitcoin started to experience excellent volatility this morning as European markets opened with modest growth. Data from Cointelegraph Markets Pro showed that BTCUSD is growing rapidly on Wednesday, reaching $ 39,000 before consolidation. The pair made a steady return overnight, with an overall improvement of 7% from Tuesday’s lows. In 2022, the stock market has fallen by over 13% so far, surpassing Bitcoin’s decline of approximately 8%. Despite fewer trading days, the technology-oriented index has proven more active than crypto and BTC in terms of volatility since the beginning of this year. Both groups of assets are still closely linked. By Bloomberg statistics, Bitcoin has a coefficient that correlates with Nasdaq’s 100 and approaches ATH higher than we’ve ever seen before. Risk aversion has been permanently altered by the violent bitcoin sale in January, which fell in value to as much as $ 33,000. According to a study by CryptoCompare, the volume of trading companies on the cryptocurrency exchange fell by more than 30 percent in January.
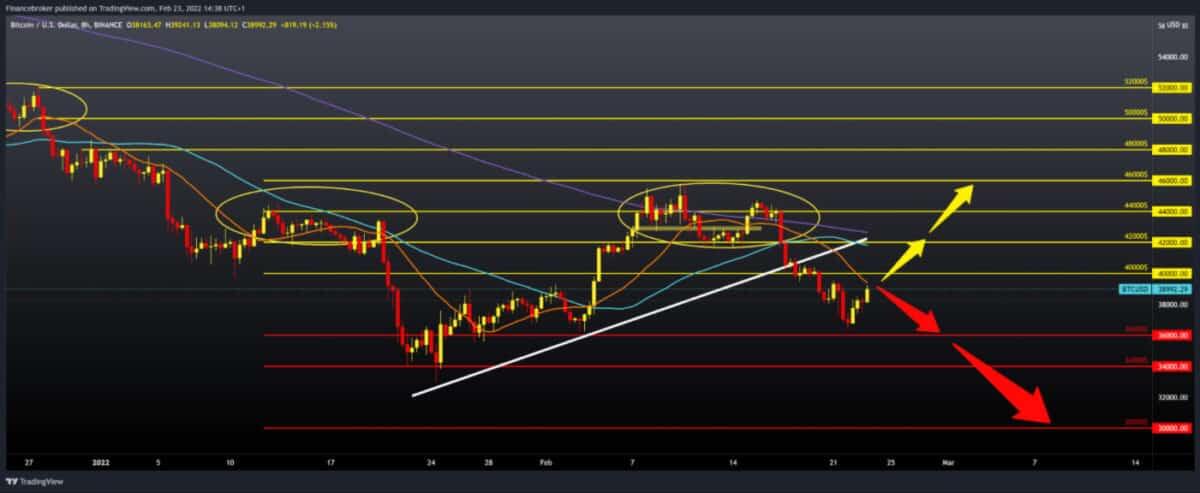
Bullish scenario:
We need continued positive consolidation and price growth above $ 40,000.
We can get additional support in the MA20 moving average at that level.
If this bullish impulse continues, our next resistance is at $ 42,000, where MA50 and MA200 moving averages await us as additional resistance to further bullish continuation.
The break above could lead us to a zone of about $ 44,000, the site of a previous attempt to move on.
Bearish scenario:
We need negative consolidation and a new price withdrawal below $ 38,000.
Then we continue to the previous low of $ 36,000.
With increased bearish pressure, the next support awaits us at $ 34,000, the January support zone.
If the dollar continues to strengthen due to the geopolitical situation, we can expect investors to shift their capital from Bitcoin to safer currencies and gold.
That could lower Bitcoin well below support to $ 33,000 and form a new low this year.
Ethereum chart analysis
The price of Ethereum has also been recovering since yesterday after finding support at $ 2,500. The price has managed to recover to the current $ 2,735, and we are now testing the MA20 moving average to continue this bullish momentum.
Bullish scenario:
We need to continue this positive consolidation, and we need to make a break above the $ 2800 level.
Our next resistance is at $ 2,900, where the MA50 moving average awaits us.
A little above we reach the $ 3,000 price, and if ETH continues, our next target is the $ 3,200 zone.
The additional resistance at $ 3,200 costs us the MA200 moving average.
Bearish scenario:
We need a negative consolidation that would pull the price towards $ 2,500 previously low.
If bearish pressure continues, we can expect further price increases, up to $ 2,400 first.
And if that support doesn’t last, we can expect about $ 2,200.