


Bitcoin and Ethereum Face Resistance: Market Trend Analysis
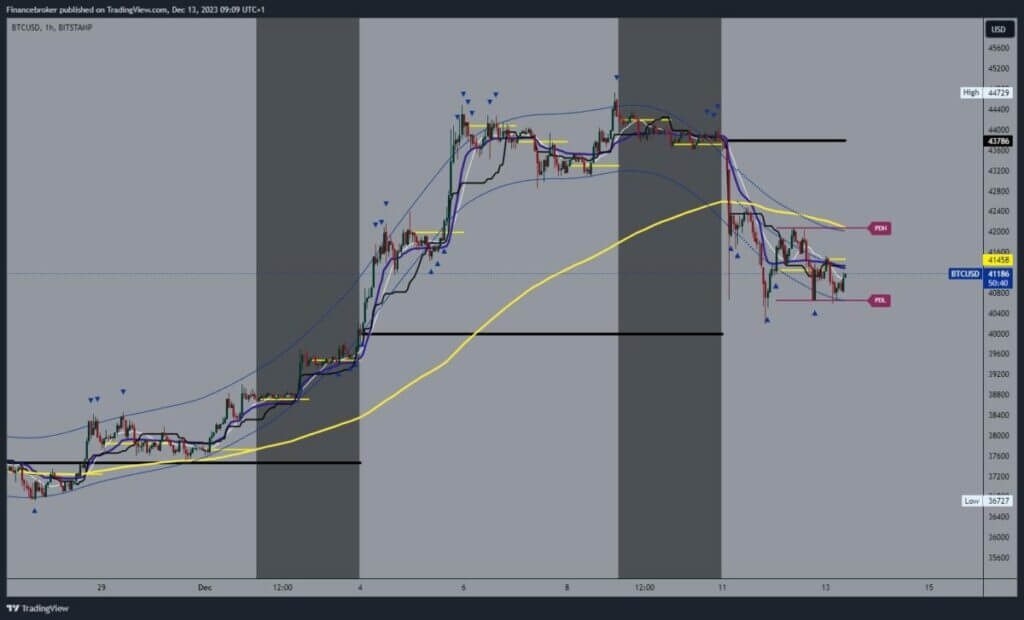
- The price of Bitcoin recovered only to the $42,000 level yesterday.
- The price of Ethereum remains today very close to this week’s low.
Bitcoin chart analysis
The price of Bitcoin recovered only to the $42,000 level yesterday. There, we encountered resistance, which led to a new price pullback to the $40,600 level. We remain under pressure as we fail to move above the $41500 level, and today, we are moving in the $40600-$41500 range. For a bullish option, we need a jump above the upper resistance line in order to start a recovery to the bullish side. Potential higher targets are $42000 and $42400 levels.
An additional resistance and obstacle to the bullish option could be the EMA50 moving average in the zone around the $42000 level. We need a negative consolidation and a price drop below the $40400 level for a bearish option. This would see the formation of a new low and confirmation of the bearish trend. Potential lower targets are the $40,000 and $39,600 levels.

Ethereum chart analysis
The price of Ethereum remains today very close to this week’s low. A few hours ago, we tested the low again at the $2145 level. For now, we remain above that level, recovering slightly to the $2175 level. We need a continuation of the positive consolidation to get out of the bearish pressure. Potential higher targets are $2200 and $2220 levels.
The EMA50 moving average in the zone around the $2240 level is another resistance and obstacle to further recovery. We need a negative consolidation and a price drop below the $2145 level for a bearish option. Thus, we would see the formation of a new low and the confirmation of a bearish trend. Potential lower targets are $2120 and $2100 levels.


