Bitcoin and Ethereum: Ethereum falls to $1799 yesterday
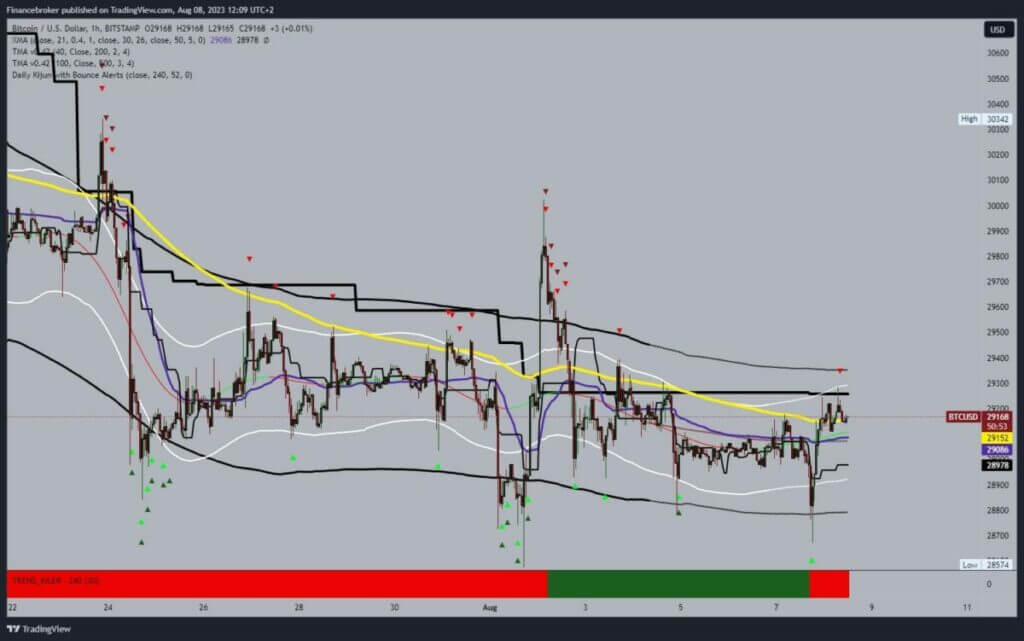
- Yesterday, we saw another drop in the price of Bitcoin, this time to the $28,700 level.
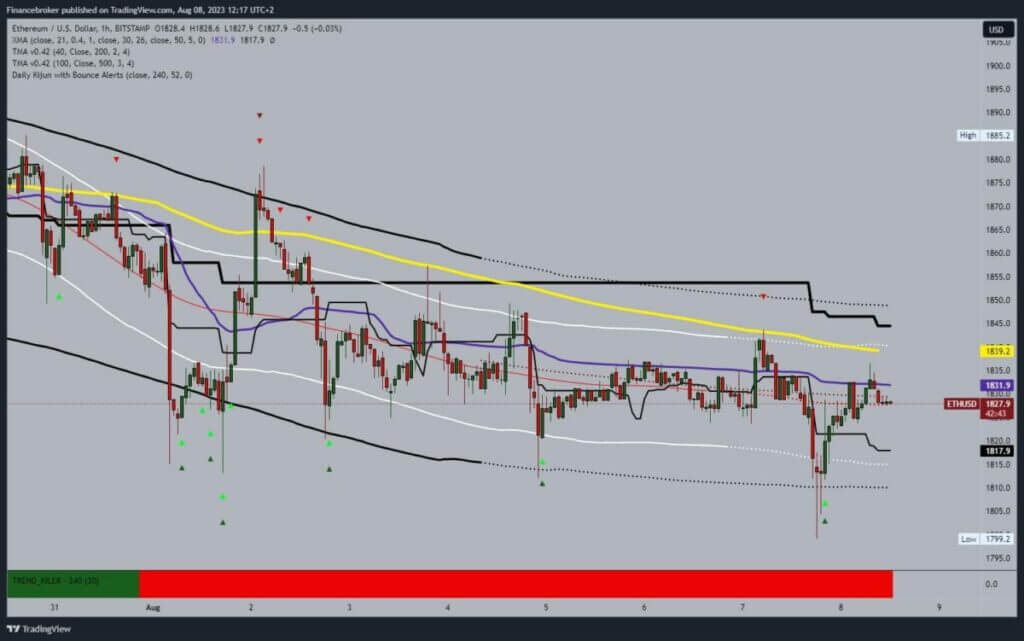
- Ethereum price fell to $1799 yesterday, the lowest since June 21.
Bitcoin chart analysis
Yesterday, we saw another drop in the price of Bitcoin, this time to the $28,700 level. We managed to consolidate at that level and return above the $29,000 level with new momentum. Today’s movement is in the $29100-$29250 range, around the EMA50 moving average.
For a bullish option, we need to hold above the EMA50 in order to have better support to continue to the bullish side. Potential higher targets are $29300 and $29400 levels.
We need a negative consolidation and a new price pullback below the $29,000 level for a bearish option. Again, we would be under pressure to see a new bearish impulse. Potential lower targets are $28900 and $28800 levels.

Ethereum chart analysis
Ethereum price fell to $1799 yesterday, the lowest since June 21. A recovery soon followed, and with bullish consolidation, we would have returned to the $1830 level. The current support is at the $1825 level, and we manage to stay above it for now. We need a jump to the $1840 level, where we would test the EMA50 moving average.
A break above the EMA50 and the $1840 level would significantly improve the picture for further bullish recovery. Potential higher targets are $1850 and $1860 levels. We need a negative consolidation and pullback to the $1820 support level for a bearish option. A break below it would cause prices to start falling further and visit lower levels. Potential lower targets are $1810 and $1800 levels.


