Bitcoin and Ethereum: Ethereum breaks above the $2400 level
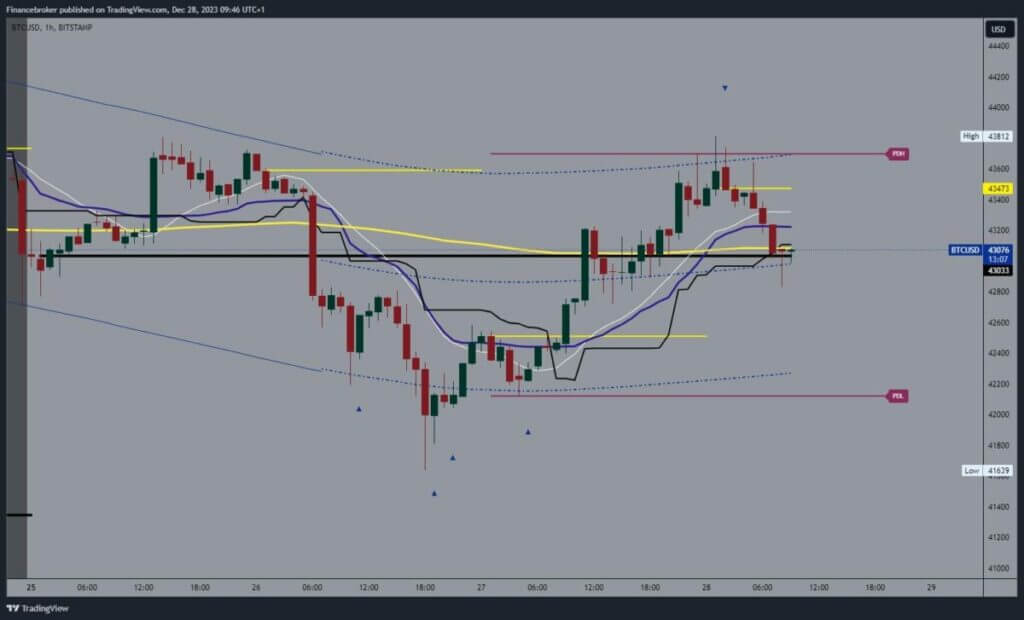
- Yesterday, we saw a bullish consolidation of Bitcoin price up to the $43812 level.
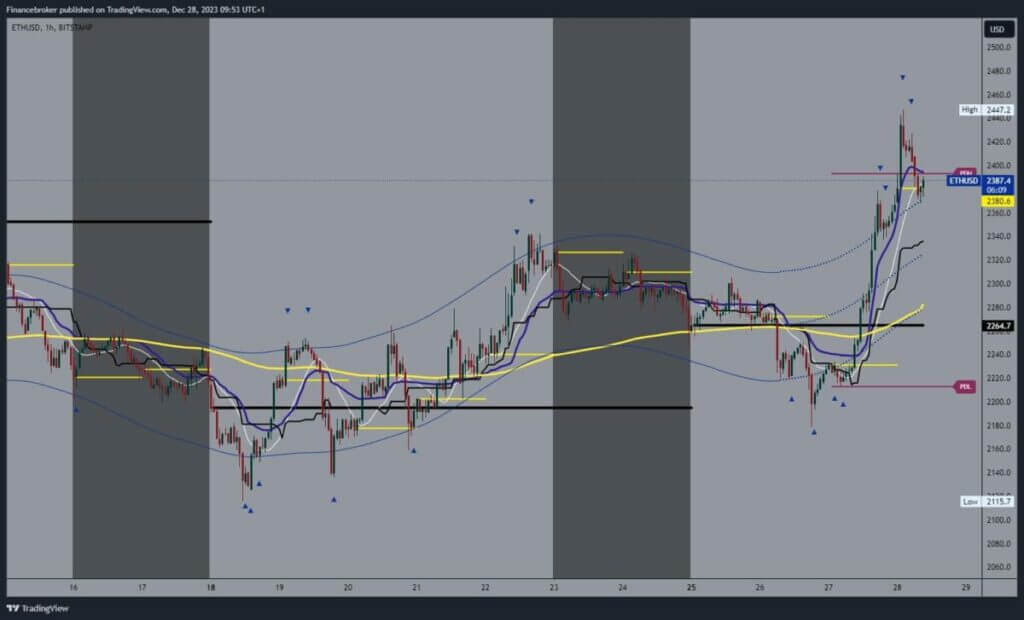
- Yesterday, we saw the Ethereum price jump to the $2447 level.
Bitcoin chart analysis
Yesterday, we saw a bullish consolidation of Bitcoin price up to the $43812 level. This week, we have resistance in the zone around $43800. This leads to today’s bearish consolidation and pullback to the $43000. Here we are now testing the EMA50 moving average, and if we stay below it, the price could easily give way and start a bearish continuation. Potential lower targets are $42800 and $42600 levels.
We need to establish ourselves above the EMA50 and the $43200 level for the bullish option. After that, we would have a good position from which to start further recovery. We would again have the opportunity to visit yesterday’s high, and the potential higher targets are the $43400 and $43600 levels.

Ethereum chart analysis
Yesterday, we saw the Ethereum price jump to the $2447 level. This is where we formed this year’s new price high. The price stops at that level and retreats to support at the $2370 level. Now, we find support here and recover slightly to the $2390 level. If this positive consolidation continues, we could expect to climb above the $2400 level. Potential higher targets are $2420 and $2440 levels.
We need a negative consolidation and a drop below the support at $2370 for a bearish option. The next lower support is at the $2340 level, and if we break below that as well, we could see a deeper pullback in the price of Ethereum. Potential lower targets are $2320 and $2300 levels. The EMA50 moving average is in the zone around the $2300 level.


